User talk:Quinnnnnby

From Wikimedia Commons, the free media repository
Jump to navigation Jump to search
Welcome to Wikimedia Commons, Quinnnnnby!

-- Wikimedia Commons Welcome (talk) 15:07, 18 September 2021 (UTC)[reply]


Election maps[edit]

Hello dear Quinby, you apparently think that Common's service of categorization is done by bots, but we're also just users doing volunteer work. The category "Maps" gets redirected towards "Unidentified maps" and from there, others like me have to identify them manually. If you please take a little time to find the most suitable sub-categories, I'd thank you a lot! All the best wishes and hoping for many more maps from your side, greets Enyavar (talk) 13:40, 18 August 2022 (UTC)[reply]

Your election charts[edit]

Thank you for uploading images. Please do not categorize manually into Meta-categories, where correct description is easy with sripts and templates.
I corrected 2023 Czech Presidential Election Polls round 2.svg and Next Catalan regional election polls.png, would you mind to treat all your other SVG files ?
Can you avoid to embed raster images into SVG, as in 2023 Czech Presidential election, 2nd round.svg ? -- sarang사랑 09:47, 21 February 2023 (UTC)[reply]

Hi @Sarang, do you mind telling me which parts are raster images? All of the elements are vectors as far as I am aware. Thanks Quinnnnnby (talk) 10:09, 21 February 2023 (UTC)[reply]

Hi, the script detected an embebbed raster, it is a small image at stmt 954 of the SVG code. When I remove that image, there is no difference of the display. I checked some others of your maps but didn't see another case of rasters embedded. Therefore your generations of SVG seems to be o.k., without a systemic bug. To your information, it is considered as an error but no reason to correct it by another upload! -- sarang사랑 11:03, 21 February 2023 (UTC)[reply]

@Sarang, ok I think I've fixed all the problems - thanks for pointing them out! Quinnnnnby (talk) 13:44, 21 February 2023 (UTC)[reply]

Yes, looks good now! I re_checked the file; when you want to check your SVG files yourself, you can do it supported by the script. -- sarang사랑

2009 EU election in NI.svg contains also a large image, at the end of the code (stmt 1304) Its removal reduces the file size from 926KB to 149KB (16%), without any visual difference. -- sarang사랑

Round 1 of Picture of the Year 2022 voting is open![edit]

2022 Picture of the Year: Saint John Church of Sohrol in Iran.

Read this message in your language

Dear Wikimedian,

Wikimedia Commons is happy to announce that the 2022 Picture of the Year competition is now open. This year will be the seventeenth edition of the annual Wikimedia Commons photo competition, which recognizes exceptional contributions by users on Wikimedia Commons. Wikimedia users are invited to vote for their favorite images featured on Commons during the last year (2022) to produce a single Picture of the Year.

Hundreds of images that have been rated Featured Pictures by the international Wikimedia Commons community in the past year are all entered in this competition. These images include professional animal and plant shots, breathtaking panoramas and skylines, restorations of historical images, photographs portraying the world's best architecture, impressive human portraits, and so much more.

For your convenience, we have sorted the images into topical categories. Two rounds of voting will be held: In the first round, you may vote for as many images as you like. The top 30 overall and the two most popular images in each category will continue to the final. In the final round, you may vote for just three images to become the Picture of the Year.

Round 1 will end on UTC.

Click here to vote now!

Thanks,
the Wikimedia Commons Picture of the Year committee

You are receiving this message because you voted in the 2021 Picture of the Year contest.

Delivered by MediaWiki message delivery (talk) 09:15, 20 April 2023 (UTC)[reply]

2023 Ecuadorian general election-second round[edit]

Hi Quinnnnnby Do you have any plans to make a map on the runnof election of the 2023 Ecuadorian presidential election? Greetings Segagustin (talk) 18:35, 18 October 2023 (UTC)[reply]

Hello, it's already in the works, and it should be done by tomorrow at the latest. Been a bit busy recently, sorry for the delay! Quinnnnnby (talk) 19:17, 18 October 2023 (UTC)[reply]

2022 Sheffield Election map[edit]

Hi - just to let you know, your map of the 2022 Sheffield election has a mistake: Nether Edge & Sharrow ward is coloured yellow when it should be red. All the best! — Preceding unsigned comment was added by 82.45.152.152 (talk) 09:02, 11 April 2024 (UTC)[reply]

Fixed Quinnnnnby (talk) 22:34, 16 April 2024 (UTC)[reply]

Election maps[edit]

Hi Quinnnnnby, I am trying to learn illustration and am curious about how and what you use to create the election maps? Thanks AINH (talk) 03:25, 7 May 2024 (UTC)[reply]

@AINH Hello, it's all self-taught on a free program Inkscape. As long as you can find a .svg file, you can edit it in Inkscape easily. Regards Quinnnnnby (talk) 08:48, 7 May 2024 (UTC)[reply]

Poll Charts[edit]

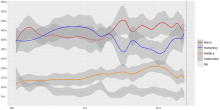
I was wondering if you could please give me a quick rundown of how to create the Charts that you've made for the 2024 US Presidential Election among others. As the regular graph charts on Wikipedia have been unavailable for a long time now, I'd like to take those polls that I've collected in other articles and format them much the same way you do. However I'm lost at how to create the chart(s) in RGui, not being familiar at all with R Code. Ariostos (talk) 18:02, 18 May 2024 (UTC)[reply]

@Ariostos Hi! I was not too familiar with R code myself before learning how to make these. If you want, below is my R code I use for the US chart (ignore the colons). You'll have to install all the packages mentioned in library, have a look at the R wiki page for more info on that. The bits that need to be changed are the dates for the next election (election<-... "dd mm yyyy") and the old election (old<-... "dd mm yyyy"); the span value (higher is a smoother regression line, often needed when there are fewer polls); the party colours (just the hexcodes on the line starting scale_color_manual); and the file names.

If you already have the polls compiled, they need to be in a csv (comma delimited) file, with A1 as date, then the dates below as "DD/MM/YYYY" (I use the end date of the fieldwork), one row for each poll. Each following column should begin with the Candidate/Party name in the 1 row, and then the poll results in decimals (e.g., 0.48, 0.3, 0.1023, etc) below for each poll, in line with their relevant date. If there is no data for a candidate, instead of a number you just put "-".

Just to warn you, this isnt the most efficient way of doing things, it's just how I do it!
Let me know if you have any questions, though I would warn you I'm not an expert. Regards Quinnnnnby (talk) 22:14, 18 May 2024 (UTC)[reply]
:setwd("C:/Users/Username/Documents/US election")
:library(ggplot2)
:library(tidyquant)
:library(scales)
:library(formattable)
:library(reshape2)
:library(readr)
:library(stringr)
:library(Cairo)
:library(svglite)
:library(Rcpp)
:value <- read_csv("US polls.csv")
:value <- melt(value, id.vars="Date")
:value$Date<-as.Date(value$Date, "%d/%m/%Y")
:value$value<-formattable::percent(value$value)
:election<-as.Date("05 11 2024", "%d %m %Y")
:old<-as.Date("03 11 2020", "%d %m %Y")
:plot <- ggplot(data=value,aes(x=Date,y=value, colour=variable, group=variable)) +
:  geom_point(size=1.65, alpha=0.5) +
:  scale_color_manual(values = c("#4c90ff","#ff4c4cff"), labels = ~ stringr::str_wrap(.x, width = 20))+
:  geom_smooth(method="loess",fullrange=TRUE,se=TRUE,linewidth=1.45,span=0.25, data=value[value$Date!=old & value$Date!=election, ])+
:  scale_y_continuous(name="Vote",labels = scales::percent_format(accuracy = 5L),breaks=seq(0,0.8,0.05))+
:  theme(axis.title=element_blank(),
:        legend.title=element_blank(),
:        axis.text.x = element_text(color = "grey20", size = 19, angle = 0, hjust = .5, vjust = .5, face = "plain"),
:        axis.text.y = element_text(color = "grey20", size = 19, angle = 0, hjust = 0, vjust = 0.4, face = "plain"),
:        legend.key.size = unit(2.5, 'lines'), legend.text = element_text(size=20))+
:  geom_vline(xintercept=election, linetype="solid", color = "#56595c", alpha=0.5, size=1)+
:  geom_vline(xintercept=old, linetype="solid", color = "#56595c", alpha=0.5, size=0.75)+
:  xlim(min(value$Date), election)+
:  geom_point(data=value[value$Date==old,],size=6, shape=18, alpha=0.5)+
:  geom_point(data=value[value$Date==old,],size=6.1, shape=5, alpha=0.5)+
:  geom_point(data=value[value$Date==election, ],size=6, shape=18, alpha=0.5)+
:  geom_point(data=value[value$Date==election, ],size=6.1, shape=5, alpha=0.5)
:plot <- plot + guides(color = guide_legend(override.aes = list(shape = c(NA, NA))))
:ggsave(plot=plot, file="US 2024.svg", width=20, height=10)
:aaa=readLines("US 2024.svg",-1)
:bbb <- gsub(".svglite ", "", aaa)
:writeLines(bbb,"US 2024.svg")
:
Quinnnnnby (talk) 22:14, 18 May 2024 (UTC)[reply]
So what I'm attaching below is what I have come up with, and it works; I'll also attach the generated chart. The biggest problem I have right now is that it is claiming that I need five overrides, plot <- plot + guides(color = guide_legend(override.aes = list(shape = c(NA, NA, NA, NA, NA)))), but that results in an NA showing up in the legend alongside the candidates; if I take it down to four, it refuses to generate the chart at all. I'm also curious how you made those closing results, for example in the chart you have for the 2023 Czech Election; all these charts are going to be of elections that have wrapped up, so it'd be good to have. Ariostos (talk) 10:25, 21 May 2024 (UTC)[reply]
:::setwd("C:/Users/james/Documents/US election")
:::library(ggplot2)
:::library(tidyquant)
:::library(scales)
:::library(formattable)
:::library(reshape2)
:::library(readr)
:::library(stringr)
:::library(Cairo)
:::library(svglite)
:::library(Rcpp)
:::value <- read_csv("US polls.csv")
:::value <- melt(value, id.vars="Date")
:::value$Date<-as.Date(value$Date, "%d/%m/%Y")
:::value$value<-formattable::percent(value$value)
:::election<-as.Date("05 11 1968", "%d %m %Y")
:::old<-as.Date("03 11 1964", "%d %m %Y")
:::plot <- ggplot(data=value,aes(x=Date,y=value, colour=variable, group=variable)) +
:::  geom_point(size=1.65, alpha=0.5) +
:::  scale_color_manual(values = c("#E81B23","#3333FF","#FF7F00","#C0C0C0"), labels = ~ stringr::str_wrap(.x, width = 20))+
:::  geom_smooth(method="loess",fullrange=TRUE,se=TRUE,linewidth=1.45,span=0.25, data=value[value$Date!=old & value$Date!=election, ])+
:::  scale_y_continuous(name="Vote",labels = scales::percent_format(accuracy = 5L),breaks=seq(0,0.8,0.05))+
:::  theme(axis.title=element_blank(),
:::        legend.title=element_blank(),
:::        axis.text.x = element_text(color = "grey20", size = 19, angle = 0, hjust = .5, vjust = .5, face = "plain"),
:::        axis.text.y = element_text(color = "grey20", size = 19, angle = 0, hjust = 0, vjust = 0.4, face = "plain"),
:::        legend.key.size = unit(2.5, 'lines'), legend.text = element_text(size=20))+
:::  geom_vline(xintercept=election, linetype="solid", color = "#56595c", alpha=0.5, size=1)+
:::  geom_vline(xintercept=old, linetype="solid", color = "#56595c", alpha=0.5, size=0.75)+
:::  xlim(min(value$Date), election)+
:::  geom_point(data=value[value$Date==old,],size=6, shape=18, alpha=0.5)+
:::  geom_point(data=value[value$Date==old,],size=6.1, shape=5, alpha=0.5)+
:::  geom_point(data=value[value$Date==election, ],size=6, shape=18, alpha=0.5)+
:::  geom_point(data=value[value$Date==election, ],size=6.1, shape=5, alpha=0.5)
:::plot <- plot + guides(color = guide_legend(override.aes = list(shape = c(NA, NA, NA, NA, NA))))
:::ggsave(plot=plot, file="US 1968.svg", width=20, height=10)
:::aaa=readLines("US 1968.svg",-1)
:::bbb <- gsub(".svglite ", "", aaa)
:::writeLines(bbb,"US 1968.svg")
:::
Ariostos (talk) 10:27, 21 May 2024 (UTC)[reply]
AriostosRCodeTestOne
Ariostos (talk) 10:32, 21 May 2024 (UTC)[reply]