Economic diagram
Jump to navigation
Jump to search

An economic diagram is a diagram representing macro-economical or business economical processes. In a broad sense economic diagrams also relate to economic charts and economic graphs, which are partly included here.
History macroeconomic diagrams[edit]
The different types of macroeconomic diagrams shown in historical order.
18th century[edit]
-
 Tableau économique by Francois Quesnay, 1759
 -
 Products map of Europe by August Crome, 1782:
 -
 Time series graph of trade balances by William Playfair, 1786
 -
 Exports and Imports of Scotland 1780-81 by William Playfair, 1786


19th century[edit]
- Economic charts, flow maps etc., 19th century
-
 Pie charts from Playfair's "Statistical Breviary" by William Playfair, 1801
 -
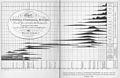 Chart of Universal Commercial History by William Playfair, 1805
 -
 Bar chart, Price of Wheat and Wages 1565-1821 by William Playfair, 1822
 -
 "Linear Chronology" by William Playfair, 1824
 -
 Choropleth map by Charles Dupin, 1834
 -
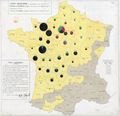
 Statistique de la Population Francaise by Adolphe d'Angeville, 1836
 -
 Population dot map, 1830
 -
 Minard's chart of commercial movements in the Canal du centre in 1844
 -
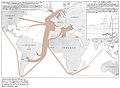
 Minard's map of cattle sent from all around France for consumption in Paris (1858).
 -
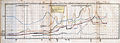
 Line chart of cotton and wool production and import, 1858-61 by Minard
 -
 Minard’s map of French wine exports for 1864


- Economic graphs, 19th century
-
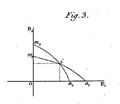
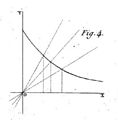
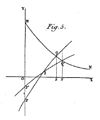
 Ímages of Researches into the Mathematical Principles of the Theory of Wealth images by Antoine Augustin Cournot, 1838
 -
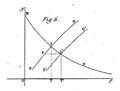
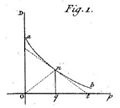 Of the law of demand by Antoine Augustin Cournot, 1838
 -
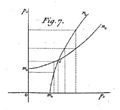
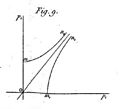
 Of the competition of producers, 1838
 -
 Of the competition of producers, 1838
 -
 Of the competition of producers, 1838
 -
 Of the competition of producers, 1838
 -
 Of unlimited competition, 1838
 -
 Of the mutual relations of producers, 1838
 -
 Of the mutual relations of producers, 1838
 -
 Of the mutual relations of producers, 1838
 -
 Of the mutual relations of producers, 1838
 -
 Principe d’une théorie mathématique de l’échange by Léon Walras, 1874
 -
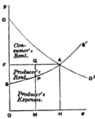
 Alfred Marshall's elasticity of demand, 1890
 -
 Alfred Marshall's supply and demand graph, 1895


,_1838.jpg)
,_1838.jpg)
,_1838.jpg)
,_1838.jpg)

,_1838.jpg)
,_1838.jpg)
,_1838.jpg)
,_1838.jpg)


- Economic diagrams, 19th century
-
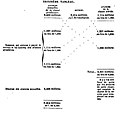
 Formule du Tableau Economique, 1848
 -
 Second Tableau, 1848
 -
 Tableau de la Distribution, 1848
 -
 Troisieme Tableau, 1848
 -
 The capital circle by John Stuart Mill & James Laurence Laughlin, 1885
 -
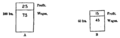
 Wealth rectangles, 1885
 -
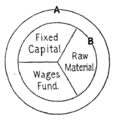 Diagram of Wages-Fund Theory, 1885
 -
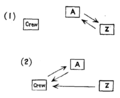 Demand for Commodities is not Demand for Labor, 1885
 -
 Cost of production, 1885
 -
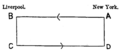 Foreign exchange, 1885
 -
 Conception of the flow of the currency by Simon Newcomb, 1885
 -
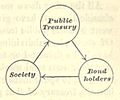 Society, Public Treasury and Bondholders, 1885
 -
 Society, Public Treasury and Bondholders spending money in building a railway, 1885
 -
 Flow of rent paid to landlord by tenants, 1885
 -
 Flow of the currency when merchant builds a new store, 1885
 -
 Flow of money from wearers of boots to its producers, 1885
 -
 Change of expenditure by change of occupation, 1885
 -
 Change of business and change in Agent's expenditure, 1885
 -
 Object of economics, a three-cornered relation, by James Mavor, 1889
 -
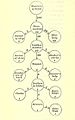
 Diagram of economic history and theory, 1889
 -
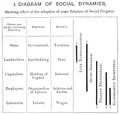 Diagram of Social Dynamics, 1889


- See also
20th century[edit]
- Economic diagrams, first part of 20th century
-
 Economic production and distribution by Seager, 1904
 -
 Economic value, price and distribution by Seager, 1904
 -
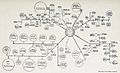
 The Rockefeller-Morgan Family Tree, 1904
 -
 Greater New York Public Utility Family Tree, 1904
 -
 Greater Steam Railroad Groups, 1904
 -
 Systems of advertising, 1906
 -
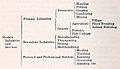
 Classification of the Industrial Population by Hagerty, 1905
 -
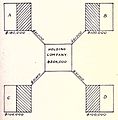
 Chart of holding company, 1909
 -
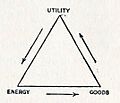 Economic Life triange by Nearing, 1909
 -
 Reverses in the Economic Life triange, 1909
 -
 Capitalistic production in a self-contained industrial society, 1911.
 -
 JP Morgan Banking Influence in Large Corporations, 1914
 -
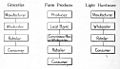 Channels of distribution for various lines of goods by Nystrom, 1915.
 -
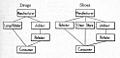 Channels of distribution, Drugs and Shoes by Nystrom, 1915.
 -
 Channels of distribution, Co-Operative Fruit Marketing by Nystrom, 1915
 -
 Wheeled chart of National Bureau of Standards activities, 1915
 -
 Class battle fronts diagram, 1917
 -
 Method of payment for American purchase of foreign goods, 1919
 -
 Organization of Capital with Holding Corporation, 1919
 -
 Diagram of gratifying wants, 1921
 -
 Manufacture of Wooden Cloth under Domestic System by L.C. Marshall, 1921
 -
 Differentiation of productive enterprises by L.C. Marshall, 1921
 -
 Cooperating specialized business units in Egg Production by L.C. Marshall, 1921
 -
 Cooperating Specialized Business Units in Wheat Flour Production by L.C. Marshall, 1921
 -
 Cooperating Specialized Business Units by L.C. Marshall (after Nystrom), 1921
 -
 Business Unites Cooperate in Producing Services by L.C. Marshall, 1921
 -
 Business Unites in producing the Service of Money by L.C. Marshall, 1921
 -
 Circuit flow of money by W.T. Foster, 1922
 -
 The Round Flow of Money Income and Expenditure, 1922
 -
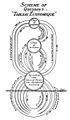 Scheme of Quesnay's Tableau Economique by Lewiński, 1922
 -
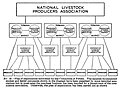 Plan of Organization for National Livestock Producers Association by Randall (1), 1928
 -
 Plan of Organization for National Livestock Producers Association by Randall (2), 1928
 -
 Organisation of Dutch industry, 1942


,_1921.jpg)


,_1928.jpg)
,_1928_03.jpg)

- Economic diagrams, second part of 20th century
-
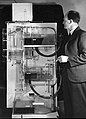 Phillips and MONIAC LSE, 1958-1967
 -
 The competitive price system adapted from Samuelson, 1961
 -
 U.S. sulfur flow diagram adapted from Ober, 1992
 -
 U.S aluminum flow diagram adapted from Wilburn and Wagner, 1993
 -
 Circular flow model by Hrubovcak, 1995


21st century[edit]
- Economic diagrams, 21st century
-
 Five sector circular flow diagram, 2006
 -
 Electricity Market Complex Adaptive System, 2007
 -
 Electricity Market Complex Adaptive System, 2007
 -
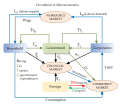 Circulation in macroeconomics, 2007
 -
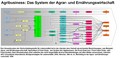
 System of Agribusiness, 2007
 -
 Agribusiness Chain, 2007
 -
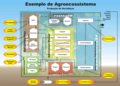 Agri ecosystem, 2007
 -
 Systems thinking about the society, 1986-2007
 -
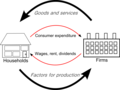 Two sector circular flow diagram, 2008
 -
 With surroundings, 2008
 -
 Four sector circular flow diagram, 2009
 -
 Local, regional and global markets, 2010
 -
 Diagram of a Functional Macroeconomics System, 2011
 -
 Three sector circular flow diagram, 2011
 -
 Supply and demand network, 2011

.jpg)
.jpg)


.png)


.png)
Types of macroeconomic diagrams[edit]
Economic graphs[edit]
Conceptual models of economic processes[edit]
- See also: Category:Economic models
-
 AD–AS model, aggregate supply and demand
 -
 Cobweb model, prices in fluctuating markets
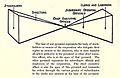
 -
 Edgeworth box, various distributions of resources
 -
 Heckscher–Ohlin model, general equilibrium in international trade
 -
 Indifference curve, quantities of two goods for which a consumer is indifferent.
 -
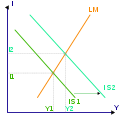 IS–LM model, interest rates and output in goods-, services- and money market
 -
 J curve tendency for early negative returns and later investment gains
 -
 Laffer curve, rates of taxation and levels of government revenue.
 -
 Lorenz curve, distribution of income or of wealth.
 -
 Phillips curve, rates of unemployment and inflation
 -
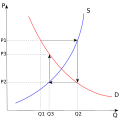
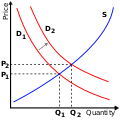 supply and demand model

.svg)


Graphical representation of real economic processes[edit]
- See also: Category:Economic curves
-
 Beveridge curve about unemployment and job vacancy rate
 -
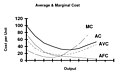 Cost curve, costs of production and quantity produced
 -
 Duck curve of power production over the day
 -
 Great Gatsby curve, inequality and intergenerational social immobility
 -

-
 Real gross domestic product, an example


.png)
Functional diagrams[edit]
Economic production and distribution, and similar models[edit]
-
Economic production and distribution, 1904
-
Economic value, price and distribution, 1904
-
Economic Life triange, 1909
-
Reverses in the Economic Life triange, 1909
-
Capitalistic production in a self-contained industrial society, 1911.
-
The Round Flow of Money Income and Expenditure, 1922
-
Circuit flow of money by W.T. Foster, 1922
-
 Model of an operation research study, 1959
 -
The competitive price system adapted from Samuelson, 1961
-
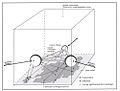 Ball cube, 1970s
 -
 Viable system model, 1972
 -
Circular flow model by Hrubovcak, 1995
-
 Time space behavior, 1995
 -
 Transformation model, 1995
 -
Five sector circular flow diagram, 2006
-
System of Agribusiness, 2007
-
Agribusiness Chain, 2007
-
Agri ecosystem, 2007
-
Systems thinking about the society, 1986-2007
-
Two sector circular flow diagram, 2008
-
With surroundings, 2008
-
Four sector circular flow diagram, 2009
-
Diagram of a Functional Macroeconomics System, 2011
-
Three sector circular flow diagram, 2011


Economic distribution[edit]
-
Channels of distribution for various lines of goods, 1915.
-
Channels of distribution, Drugs and Shoes, 1915.
-
Channels of distribution, Co-Operative Fruit Marketing, 1915
-
U.S. sulfur flow diagram adapted from Ober, 1992
-
U.S aluminum flow diagram adapted from Wilburn and Wagner, 1993
-
Agribusiness Chain, 2007
-
Agribusiness Chain, 2007
-
Supply and demand network, 2011
Other economic organization: Organization of Capital[edit]
-
The Rockefeller-Morgan Family Tree, 1904
-
Greater New York Public Utility Family Tree, 1904
-
Greater Steam Railroad Groups, 1904
-
Holding company, 1909
-
Banking Influence in Large Corporations, 1914
-
Method of payment for American purchase of foreign goods, 1919
-
Organization of Capital with Holding Corporation, 1919
Other economic organization: Systems of advertising and merchandising[edit]
-
Systems of advertising, 1906
-
Plan of Organization for National Livestock Producers Association by Randall (1), 1928
-
Plan of Organization for National Livestock Producers Association by Randall (2), 1928
Circular flow diagrams[edit]
Main gallery: Circular flow diagram.
-
The competitive price system adapted from Samuelson, 1961
-
Circular flow model by Hrubovcak, 1995
-
Two sector circular flow diagram, 2008
-
Three sector circular flow diagram, 2011
-
Four sector circular flow diagram, 2009
-
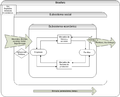
Four sectors, three market places, 2007
-
Five sector circular flow diagram, 2006
-
With surroundings, 2008
Classification charts[edit]
-
Classification of the Industrial Population, 1905
-
Class battle fronts diagram, 1917
-
Differentiation of productive enterprises, 19
-
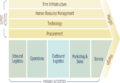 Michael Porter's Value Chain, 1985
 -
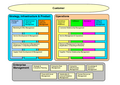 Business Process Framework (eTOM), 2001
 -
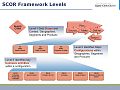 Supply-chain operations reference, 2000s
 -
 Stakeholders, 2008
 -
 Business Model Canvas, 2010


.png)

Corporation finance[edit]
-
The Rockefeller-Morgan Family Tree, 1904
-
Greater New York Public Utility Family Tree, 1904
-
Greater Steam Railroad Groups, 1904
-
 Corporation finance circular flows, 1909
 -
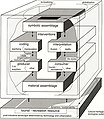
 Corporation finance pyramid, 1909
 -
Holding company, 1909
-
Banking Influence in Large Corporations, 1914


Classification of total costs[edit]
-
 Costs of Operating and Maintaining a Railroad, 1857
 -
 Symbolic Tree of Costs in Arsenal, 1885
 -
 Cost value of operations in machine shop, 1903
 -
 System concerning costs and leaks, US Steel Co, 1903.
 -
 Chart of Total Construction Costs, 1909
 -
 Dependence of total cost of supplying steam, 1914
 -
 Diagram Showing Relations of Cost Elements to Selling Price, 1919


Cost accounting systems[edit]
Main gallery: Cost accounting.
-
 Factory accounts, Books and Forms used in connection with Wages, 1889
 -
 Diagram of Manufacturing Accounts, 1896
 -
 Prime expenditure divisions of a factory, 1903
 -
 Principles of Organization by Production Factors, 1910
 -
 System of controlling Accounts, 1910
 -
 Analysis of General Ledger, 1913/19
 -
 Relation of Cost Books to Commercial Books, 1913/19
 -
 Relation of Stores Records to Commercial Records, 1913/19


Cost accounting data flow diagrams[edit]
-
Factory accounts, Books and Forms used in connection with Wages, 1889
-
 Factory accounts, Books and Forms used in connection with Prime Cost
 -
 Prime Organization Elements of an Industrial Body, 1904
 -
 Operations of a Factory System, 1913/19
 -
 Relation between Time Cards, and Work Tickets, 1919


Further reading[edit]
- Giraud, Yann. "The Supply and Demand of Graphic Representation: Visual Culture and Economics Textbooks (1948-1969) archive copy at the Wayback Machine," 2008.
- Charles, Loïc, and Yann Giraud. "Economics for the Masses: The Visual Display of Economic Knowledge in the United States (1910-45)." History of Political Economy 45.4 (2013): 567-612.