Bar chart
Jump to navigation
Jump to search
chart  | |||||
| Upload media | |||||
| Subclass of | |||||
|---|---|---|---|---|---|
| Discoverer or inventor | |||||
| Inception |
| ||||
| |||||
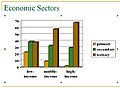
English: A bar chart is a chart with rectangular bars with lengths proportional to the values that they represent. Bar charts are used for comparing two or more values. The bars can be horizontally or vertically oriented. Sometimes a stretched graphic is used instead of a solid bar.
History[edit]
-
 Nicholas Oresme, 15th century
 -
 Philippe Buache, ca. 1770
 -
 William Playfair, 1786
 -
 William Playfair, 1821
 -
 William Playfair, 1822
 -
 André-Michel Guerry, 1833
 -
 Charles Joseph Minard, 1844
 -
 Charles Joseph Minard, 1844
 -
 1959
1959 -
 1959
1959 -
 1963
1963 -
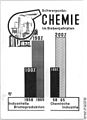
 1988
1988


Orientation[edit]
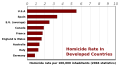
Horizontal[edit]


Vertical[edit]


Special orientation[edit]
-
 Horizontal negative bars
 -
 Horizontal positive and negative bars
 -
 Horizontal double bars
 -
 Vertical double bars

.PNG)


Number of bars[edit]
Number of bars in the chart[edit]
-
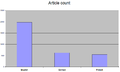
 1 bar
1 bar -
 2 bars
 -
 3 bars
 -
 4 bars
 -
 5 bars
 -
 7 bars
 -
 8 bars
 -
 9 bars
 -
 10 bars
 -
 11 bars
 -
 12 bars
 -
 15 bars


.png)


.svg)

Number of bars sets[edit]
-
Single bars
-
 Double bars
 -
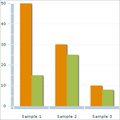
 Triple bars
 -
 Set of five bars


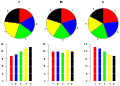
Number of bar parts[edit]
-
Bars in one part
-
 With in three parts
 -
 With four parts
 -
 With five parts

Special bar charts[edit]
3D bar charts[edit]


.PNG)
Combination with line graphs[edit]


See also: Category:Pareto charts
Combination with pie charts[edit]


Combination with tables[edit]


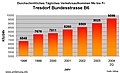
Cummulative bar charts[edit]

Histograms[edit]
A histogram is a graphical display of tabulated frequencies. It shows what proportion of cases fall into each of several categories. A histogram differs from a bar chart in that it is the area of the bar that denotes the value, not the height, a crucial distinction when the categories are not of uniform width. See Category:Histograms


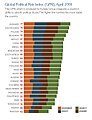
Pareto chart[edit]
A Pareto chart is a special type of bar chart where the values being plotted are arranged in descending order. The graph is accompanied by a line graph which shows the cumulative totals of each category, left to right. See Category:Pareto charts


Applications[edit]
- Category:Economic bar charts
- Category:Medical bar charts
- Category:Political bar charts
- Category:Sociological bar charts
- Category:Wikipedia bar charts