Category:Maps and diagrams of the 2011 Tōhoku earthquake
Jump to navigation
Jump to search
Subcategories
This category has the following 2 subcategories, out of 2 total.
F
T
- Maps of the 2011 Tōhoku tsunami (56 F)
Media in category "Maps and diagrams of the 2011 Tōhoku earthquake"
The following 74 files are in this category, out of 74 total.
-
 110311-F-XX000-001 (5529492518).jpg 1,811 × 1,192; 512 KB
-
 145 40 smallglobe.png 146 × 146; 7 KB
-
 145 40.png 439 × 499; 31 KB
-
 2011 Japan Sendai earthquake stat.jpg 656 × 510; 181 KB
-
 2011 Japan Sendai earthquake.jpg 1,197 × 373; 315 KB
-
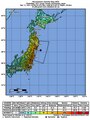
 2011 Japan shakemap.jpg 760 × 1,016; 242 KB
-
 2011 Sendai earthquake.jpg 749 × 547; 166 KB
-
 2011 Tohoku earthquake aftershocks 1year by JMA.png 975 × 640; 36 KB
-
 2011 Tohoku earthquake intensity.png 512 × 512; 52 KB
-
 2011 Tohoku earthquake mechanism main en.png 440 × 610; 19 KB
-
 2011 Tohoku earthquake mechanism main ko.png 440 × 610; 39 KB
-
 2011 Tohoku earthquake mechanism main.png 440 × 610; 19 KB
-
 2011 Tohoku earthquake Soil liquefaction map.png 1,319 × 1,649; 1.24 MB
-
 2011-Sendai-Tsunami-DART-21413-AB.png 3,507 × 2,479; 1.09 MB
-
 2011年日本東北地方太平洋近海地震的JMA观测点烈度图.png 1,098 × 1,010; 245 KB
-
 A seismogram of 2011 Tōhoku earthquake and tsunami.jpg 4,032 × 3,024; 6.79 MB
-
 Average lights in Japan in 2010.jpg 1,920 × 1,080; 348 KB
-
 C0001xgp wcmt smt.png 182 × 182; 4 KB
-
-
 Changes in gamma ray dose rate at a monitoring station near the Iitate Village hall.jpg 1,512 × 1,371; 150 KB
-

-
 Deaths by prefecture from 2011 Tohoku Earthquake.jpg 950 × 570; 95 KB
-
 Earthquake and Tsunami near Sendai, Japan (5518346220).jpg 720 × 824; 323 KB
-
 Example of new coastal embankment and breakwater.jpg 1,441 × 1,136; 242 KB
-
 Forecasted fault segments on the plate interface near the Tohoku region.jpg 1,488 × 1,844; 282 KB
-
 Gap between people moving in and people moving out as a share of the population.jpg 1,559 × 1,929; 232 KB
-
 GOES-11 Satellite Sees Pacific Ocean Basin After Japan Quake (5517505569).jpg 1,800 × 1,800; 1.56 MB
-

-
 Intensity of 2011 Tohoku earthquake Chiyoda, Tokyo.svg 1,250 × 350; 152 KB
-
 Intensity of 2011 Tohoku earthquake Kurihara, Miyagi.svg 950 × 350; 145 KB
-
 Jaapani maavärin.png 894 × 1,046; 1.1 MB
-
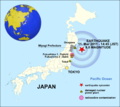
 JAPAN EARTHQUAKE 20110311 es.svg 413 × 373; 1,008 KB
-
 JAPAN EARTHQUAKE 20110311-cs.png 874 × 781; 262 KB
-
 JAPAN EARTHQUAKE 20110311-de.png 874 × 781; 170 KB
-
 JAPAN EARTHQUAKE 20110311-es.png 874 × 781; 223 KB
-
 JAPAN EARTHQUAKE 20110311-rm.png 874 × 781; 255 KB
-
 JAPAN EARTHQUAKE 20110311.png 874 × 781; 231 KB
-
 JAPAN EARTHQUAKE 20110311.svg 413 × 373; 1,008 KB
-
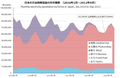 Japan electricity by forms.png 980 × 641; 69 KB
-
 Lights in Japan after earthquake.jpg 1,920 × 1,080; 348 KB
-
 Lights of Japan before and after earthquake.jpg 1,920 × 1,080; 375 KB
-
 Map of humanitarian support to the Great Eastern Japan Earthquake.svg 863 × 443; 1.54 MB
-
 Map of Sendai Earthquake 2011.jpg 897 × 749; 606 KB
-
 Mar 11 11 12.16.40 UTC.gif 456 × 499; 23 KB
-
 March112011earthquakeJapan.jpg 612 × 706; 94 KB
-
-
 Recovery concept of Minamisanriku Town.jpg 1,311 × 1,127; 143 KB
-

-
 Sanriku-Erdbeben.jpg 796 × 858; 161 KB
-
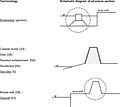 Sea defence structure terminology.jpg 2,501 × 2,232; 297 KB
-
 Sendai 2011 epicentre.png 250 × 226; 19 KB
-
 ShakeMap of The 2011 off the Pacific coast of Tohoku Earthquake.pdf 1,189 × 1,587; 3.79 MB
-
 Shindomap 2011-03-11 Tohoku earthquake.png 1,000 × 1,143; 95 KB
-
 Structure of a highly resilient breakwater.jpg 1,726 × 686; 278 KB
-
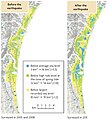 Subsidence caused by the earthquake increased inundation risks.jpg 1,301 × 1,416; 328 KB
-
 Super Asperity Model Map for the 2011 Off the Pacific Coast of Tohoku Earthquake.png 2,040 × 1,540; 425 KB
-
 Techtonic of Tohoku region as 2011 earthquake.jpg 561 × 602; 71 KB
-
 The characteristics of five overturned buildings in the town of Onagawa.jpg 715 × 1,055; 218 KB
-

-
-

-
 USGS-Poster-Tohoku Earthquake-20110311.jpg 2,593 × 1,729; 2.74 MB
-
 USGS-Poster-Tohoku-Earthquake-20110311.pdf 5,306 × 3,510; 1.14 MB
-
 Wind Rain Prediction Fukushima Japan 20110314 12UTC.PNG 490 × 414; 27 KB
-
 අප්රේල් 2011 ෆුකුෂිමා භූ චලනය.png 616 × 590; 29 KB
-
 東北地方太平洋沖地震 都道府県ごとの震度.png 1,200 × 1,200; 100 KB
-
 東北地方太平洋沖地震における長周期地震動階級.png 949 × 879; 387 KB
-
 東北地方太平洋沖地震による地殻変動(1).jpg 1,462 × 1,910; 621 KB
-
 東北地方太平洋沖地震による地殻変動(2).jpg 1,442 × 1,908; 484 KB
-
 東北地方太平洋沖地震の震度分布(気象庁).png 1,324 × 1,546; 577 KB
-
 東日本大震災による火災の原因チャート画像.jpg 509 × 509; 24 KB
-
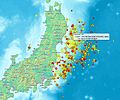
 東日本大震災の震源マップ.jpg 1,280 × 1,280; 369 KB
-
 東日本大震災自衛隊災害派遣活動場所20111121.png 1,300 × 900; 117 KB
-
 福島第一原子力発電所周辺の過去1年間の地震の震源分布と地殻変動.jpg 1,440 × 960; 669 KB
.jpg)


.jpg)


.jpg)
_(5519702076).jpg)


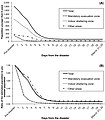
_the_modeled_estimates_of_post-disaster_population_for_those_aged_6_years_or_older_in_Minamisoma_City_and_(B)_the_ratio_of_estimated.jpg)
_the_modeled_estimates_of_post-disaster_population_younger_than_6_years_in_Minamisoma_City_and_(B)_the_ratio_of_estimated_population.jpg)


.jpg)
.jpg)


