File:Projected Change in Temperatures-cs.svg
Jump to navigation
Jump to search

Size of this PNG preview of this SVG file: 600 × 600 pixels. Other resolutions: 240 × 240 pixels | 480 × 480 pixels | 768 × 768 pixels | 1,024 × 1,024 pixels | 2,048 × 2,048 pixels | 960 × 960 pixels.
Original file (SVG file, nominally 960 × 960 pixels, file size: 1.08 MB)
Captions
Captions
Add a one-line explanation of what this file represents
Summary[edit]
| Description |
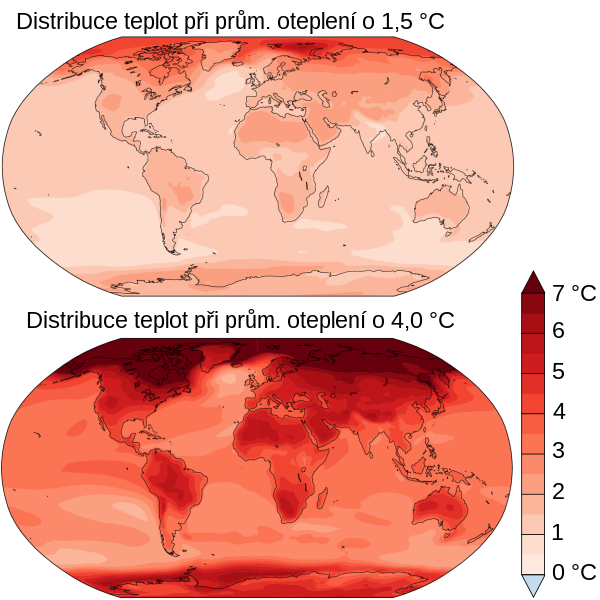
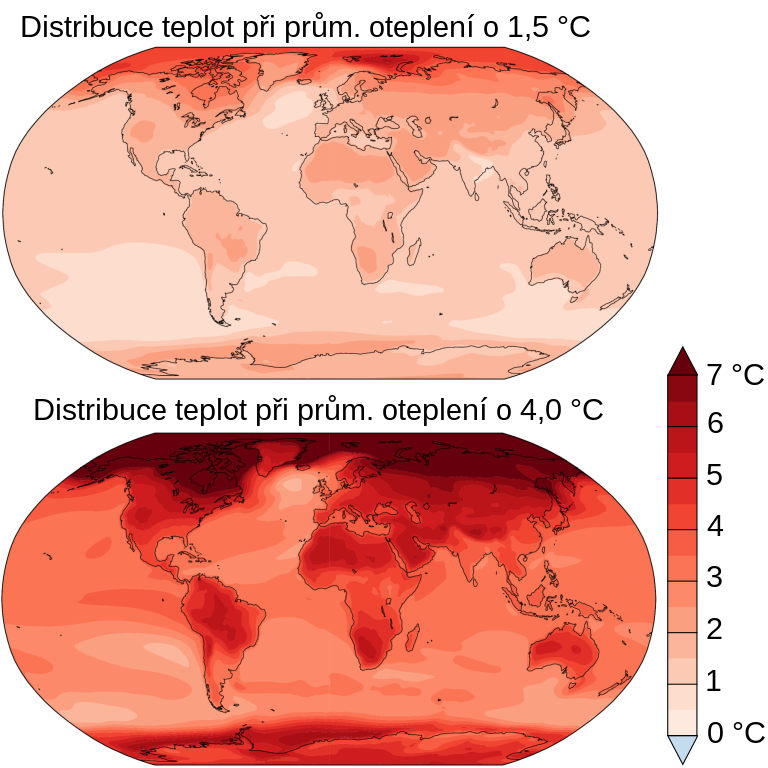
English: Coupled Model Intercomparison Project Phase 6 (CMIP6) multi-model mean projections (i.e., the average of the model projections available). Changes are shown relative to the 1850-1900. Data from the IPCC Sixth Assessment Report SPM.5.
Français : Projections moyennes multimodèles de la phase 6 du projet d'intercomparaison de modèles couplés (CMIP6) (= moyenne des projections de modèles disponibles). Les changements sont indiqués par rapport à l'ère préindustrielle (1850-1900). Données du sixième rapport d'évaluation du GIEC SPM.5
Čeština: Průměrné projekce více modelů v rámci projektu CMIP6 (Coupled Model Intercomparison Project Phase 6) (tj. průměr dostupných modelových projekcí). Změny jsou uvedeny ve vztahu k období 1850-1900. Údaje viz cs:Šestá hodnotící zpráva IPCC. SPM.5. |
| Date | |
| Source | Own work |
| Author | Efbrazil, Czech Translation Jirka Dl |
| Other versions | French version |
Licensing[edit]
I, the copyright holder of this work, hereby publish it under the following license:
This file is licensed under the Creative Commons Attribution-Share Alike 4.0 International license.
- You are free:
- to share – to copy, distribute and transmit the work
- to remix – to adapt the work
- Under the following conditions:
- attribution – You must give appropriate credit, provide a link to the license, and indicate if changes were made. You may do so in any reasonable manner, but not in any way that suggests the licensor endorses you or your use.
- share alike – If you remix, transform, or build upon the material, you must distribute your contributions under the same or compatible license as the original.
These maps contain data from the IPCC that is not believed to be subject to their copyright. According to the wikimedia article discussing derivative works using maps none of the following are subject to copyright: data, colors, systems, and geographical boundaries. That covers all that these maps display- they are standard world maps colored to show expected temperature changes according to climate change models.
File history
Click on a date/time to view the file as it appeared at that time.
| Date/Time | Thumbnail | Dimensions | User | Comment | |
|---|---|---|---|---|---|
| current | 14:52, 30 December 2021 | | 960 × 960 (1.08 MB) | Jirka Dl (talk | contribs) | Uploaded own work with UploadWizard |
You cannot overwrite this file.
File usage on Commons
There are no pages that use this file.
File usage on other wikis
The following other wikis use this file:
- Usage on cs.wikipedia.org