Category:Global warming maps of the world
Jump to navigation
Jump to search
Subcategories
This category has only the following subcategory.
G
- Global warming prediction maps (103 F)
Media in category "Global warming maps of the world"
The following 123 files are in this category, out of 123 total.
-
 16-008-NASA-2015RecordWarmGlobalYearSince1880-20160120 (120k-edited).png 400 × 225; 119 KB
-
 16-008-NASA-2015RecordWarmGlobalYearSince1880-20160120.png 1,920 × 1,080; 2.22 MB
-
1880- Global surface temperature - heat map animation - NASA SVS.webm 30 s, 1,920 × 1,080; 3.67 MB
-
 2006 temp anom.png 456 × 604; 48 KB
-
 2014 Annual Temperature Local Records.jpg 2,700 × 1,555; 773 KB
-
 2015 Annual Temperature Local Records.jpg 2,509 × 1,446; 929 KB
-
A Year In The Life Of Earth's CO2 11719-1920-MASTER.webm 3 min 10 s, 1,920 × 1,080; 460.44 MB
-
 Additional-extreme-poverty-climate-challenges (OWID 0037).png 850 × 600; 126 KB
-
 AIRS Methane.png 2,733 × 1,528; 3.16 MB
-
-
-
-
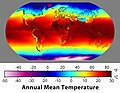 Annual Average Temperature Map.jpg 1,100 × 849; 385 KB
-
 Annual Average Temperature Map.png 8,640 × 4,320; 10.16 MB
-
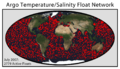 Argo Float Network.png 1,100 × 636; 168 KB
-
 Atmospheric Temperature Trend.jpg 610 × 600; 73 KB
-
 Atmospheric Temperature Trends, 1979-2005.jpg 540 × 592; 115 KB
-
 Average Seasonal Temperature Range.png 8,640 × 4,320; 4.37 MB
-
 AYool GLODAP del co3.png 1,667 × 1,133; 243 KB
-
 AYool GLODAP del pH ro.png 1,683 × 1,133; 95 KB
-
 AYool GLODAP del pH.png 1,683 × 1,133; 232 KB
-
 Change in Average Temperature (squared).png 700 × 700; 692 KB
-
 Change in Average Temperature mk.svg 960 × 816; 313 KB
-
 Change in Average Temperature With Fahrenheit.svg 960 × 864; 236 KB
-
 Change in Average Temperature zh.png 1,500 × 1,400; 1.9 MB
-
 Change in Average Temperature-ar.svg 960 × 816; 709 KB
-
 Change in Average Temperature-cs.svg 960 × 816; 317 KB
-
 Change in Average Temperature-vi.svg 960 × 864; 306 KB
-
 Change in Average Temperature.png 1,500 × 1,260; 2.17 MB
-
 Change in Average Temperature.svg 960 × 816; 235 KB
-
 Changement de la température moyenne.svg 960 × 864; 296 KB
-
 Changement prévu des températures d'ici 2090 AR6.svg 960 × 960; 1.07 MB
-
 Changement prévu des températures d'ici 2090.svg 960 × 960; 1.74 MB
-

-
 CLIMAP - non-language.PNG 703 × 428; 222 KB
-
 CLIMAP.jpg 650 × 472; 124 KB
-
 Climate change awareness by country 2008-2009.png 3,600 × 1,640; 319 KB
-
 Climate change concern by country 2008-2009.png 3,600 × 1,640; 318 KB
-
-
 Climate change opinion cause is human by country 2008-2009.png 3,600 × 1,640; 319 KB
-
 Climate Ethics Cartogram.jpg 1,224 × 792; 258 KB
-
 Climate Vulnerable Forum.png 2,753 × 1,400; 89 KB
-
 CO2 responsibility 1950-2000.svg 940 × 477; 1.98 MB
-
 Contrails Climate change atmos-chem-phys.net 19 8163 2019 acp-19-8163-2019-f02.jpg 2,067 × 4,438; 951 KB
-
 Daily Temperature Range.png 8,640 × 4,320; 4.3 MB
-
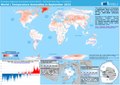 ECDM 20221017 World Temperature Anomaly September2022.pdf 2,481 × 1,754; 688 KB
-

-
Five-year average global temperature anomalies from 1880 to 2010.ogv 26 s, 1,280 × 720; 29.32 MB
-
 GHCN Temperature Stations.png 900 × 595; 82 KB
-
 GHG by country 2000.svg 940 × 477; 1.98 MB
-
 GHG by country 2005.png 1,800 × 820; 152 KB
-
 GHG intensity 2000.svg 940 × 477; 1.98 MB
-
 GHG per capita 2000 no LUC.svg 940 × 477; 1.98 MB
-
 GHG per capita 2000.jpg 746 × 397; 76 KB
-
 GHG per capita 2000.svg 940 × 477; 1.98 MB
-
 GHG per capita 2005.png 1,977 × 900; 169 KB
-
 GISS temperature 2000-09.png 1,078 × 626; 432 KB
-
 Glacier Mass Balance Map (pt).png 650 × 477; 94 KB
-
 Glacier Mass Balance Map (Zh-hans).png 650 × 477; 114 KB
-
 Glacier Mass Balance Map (Zh-hant).png 650 × 477; 115 KB
-
 Glacier Mass Balance Map German.png 650 × 477; 35 KB
-
 Glacier Mass Balance Map.png 650 × 477; 75 KB
-
 Global forest, cropland and pasture, rangeland change.webp 1,971 × 2,538; 665 KB
-
Global Temperature Anomalies from 1880 to 2019.webm 33 s, 1,920 × 1,080; 34.58 MB
-
Global Temperature Anomalies from 1880 to 2021 in °C.webm 30 s, 1,920 × 1,080; 9.31 MB
-
Global Temperature Anomalies from 1880 to 2022.webm 30 s, 1,920 × 1,080; 8.49 MB
-
 Global Temperature Anomaly - slower-1000.gif 1,280 × 720; 19.74 MB
-
 Global Temperature Anomaly - slower-200.gif 1,280 × 720; 19.75 MB
-
 Global Temperature Anomaly - slower-2000.gif 1,280 × 720; 19.74 MB
-
 Global Temperature Anomaly - slower-300.gif 1,280 × 720; 19.75 MB
-
 Global Temperature Anomaly - slower-400.gif 1,280 × 720; 19.75 MB
-
 Global Temperature Anomaly - slower-500.gif 1,280 × 720; 19.74 MB
-
 Global Temperature Anomaly Kelvin.gif 1,280 × 720; 20.1 MB
-
 Global Temperature Anomaly.gif 1,280 × 720; 19.77 MB
-
Global temperature changes.webm 37 s, 3,840 × 2,160; 60.66 MB
-
 Global Warming Map-fi.jpg 571 × 406; 85 KB
-
 Global Warming Map-gl.png 800 × 596; 453 KB
-
 Global Warming Map-he.jpg 800 × 596; 80 KB
-
 Global Warming Map-tgk.png 571 × 406; 217 KB
-
 Global Warming Map.es..png 800 × 596; 425 KB
-
 Global Warming Map.jpg 800 × 596; 212 KB
-
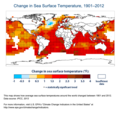
 IPCC2007 Temperature Change Worldmap.svg 940 × 477; 1.9 MB
-
 Kippelemente (Tipping Elements) - Karte.png 4,320 × 2,160; 1.04 MB
-
 Klimazonen-Prognose.gif 800 × 448; 390 KB
-
 Land and Ocean Temperature Departure from Average 2018 NOAA NCEI.gif 1,052 × 743; 135 KB
-
 Landmass Lost with Complete Polar Ice Melt (9558702416).jpg 4,096 × 2,048; 1.34 MB
-
 Localisation de la zone d'étude.jpg 1,385 × 980; 249 KB
-
 Major cities threatened by sea level rise.png 1,425 × 625; 29 KB
-
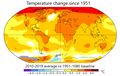 Map global warming 2010-2019.png 770 × 488; 115 KB
-
 Map of increasing heatwave trends over the midlatitudes and Europe.webp 1,999 × 953; 231 KB
-

-

-
-

-
 Mapa globalnej temperatury.JPG 571 × 406; 47 KB
-
 Mapa globalnej temperatury2.jpg 800 × 596; 206 KB
-
 Mapa temperatury globalnej.svg 1,079 × 675; 687 KB
-
 Mapa-zmeny-teploty.svg 1,052 × 744; 1.21 MB
-
NASA Global Temperature change from 1880 to 2013 high quality.webm 27 s, 1,920 × 1,080; 15.56 MB
-
NASA Global Temperature change from 1880 to 2013.webm 27 s, 1,920 × 1,080; 3.05 MB
-
 Opwarming van de Aarde map.png 774 × 522; 86 KB
-
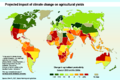
 Possible impact of Climate Change on the Mean Annual Temperature.png 6,549 × 2,695; 890 KB
-
 Prognoza świat.JPG 559 × 408; 45 KB
-
-

-
 Projected Change in Temperatures by 2090-vi.svg 960 × 960; 1.75 MB
-
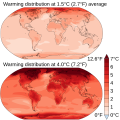
 Projected Change in Temperatures by 2090.png 1,500 × 1,500; 1.85 MB
-
 Projected Change in Temperatures-cs.svg 960 × 960; 1.08 MB
-
 Projected Change in Temperatures.svg 960 × 960; 1.07 MB
-
-
 Rank climate.gif 1,315 × 708; 241 KB
-

-
 RF-Airtraffic-Acp-19-8163-2019-f02-C2006T06.jpg 2,067 × 1,282; 1.11 MB
-
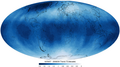
 Sea Surface Temps (14113579269).png 1,360 × 1,278; 686 KB
-
 Spatial extent of global land use- & land-cover change.webp 1,790 × 810; 249 KB
-
 STAR TTS SSU Trend.png 1,813 × 1,010; 5.25 MB
-
 Temperature anomalies 2000s.svg 1,024 × 768; 606 KB
-
 UN-REDD member countries map.jpg 900 × 451; 262 KB
-
 Van der Wiel ru.jpg 1,279 × 699; 219 KB
-
-
 YouthClimateMovement.png 1,425 × 625; 57 KB
-
 Átlaghőmérséklet a Földön.jpg 1,100 × 827; 208 KB
-
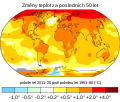
 שינויי טמפרטורה בכדור הארץ ב-50 השנים האחרונות.png 1,280 × 720; 739 KB
.png)


.png)


.png)


.png)


.png)
.png)
.png)


_-_Karte.png)


.jpg)


.jpg)
.jpg)
.jpg)
.jpg)


.png)


.png)


