File:Averages (%) of foods containing low levels of negative food components (to limit intake of any negative food component) based on the proposed method in food groups.pdf

From Wikimedia Commons, the free media repository
Jump to navigation Jump to search

Original file(4,964 × 7,020 pixels, file size: 3.17 MB, MIME type: application/pdf)

Captions

Captions

Add a one-line explanation of what this file represents

Summary[edit]

Description
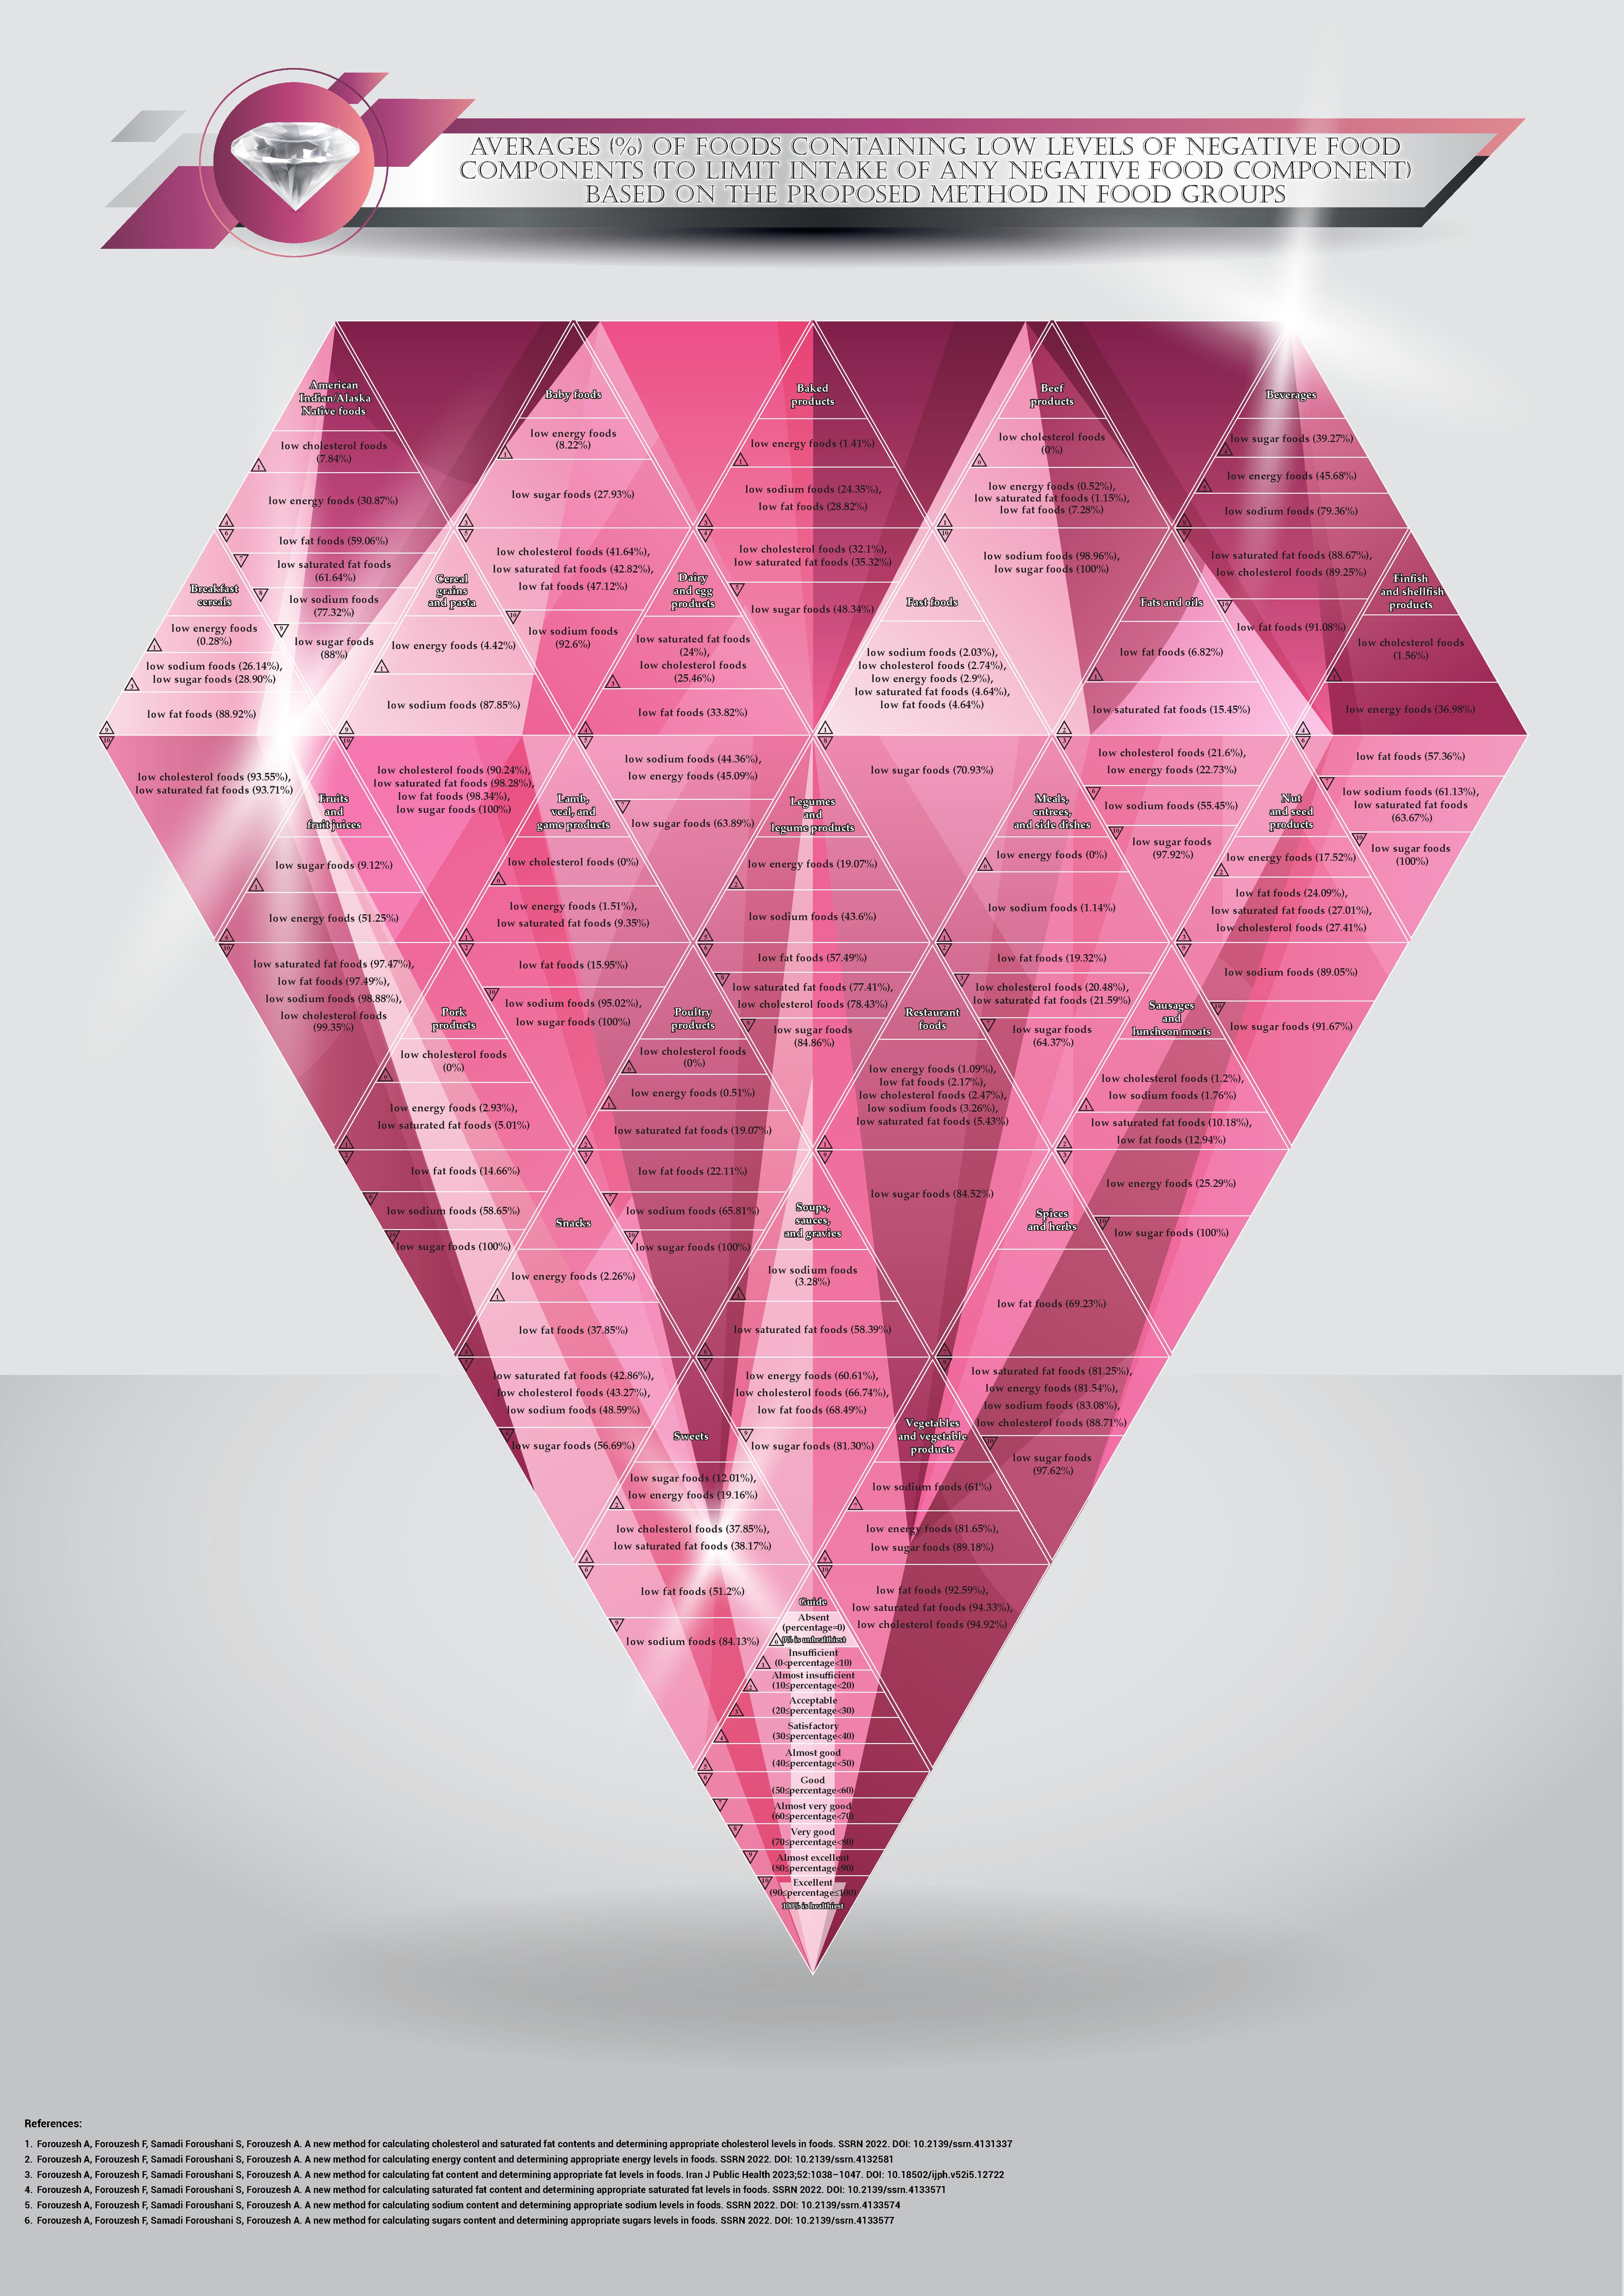
English: About 56% and 95% of foods contained cholesterol and saturated fat, respectively. On the basis of the proposed method, the averages (%) of cholesterol free and low cholesterol foods in food groups were 34.83% and 38.67%, respectively. Fruits and fruit juices (99.35% and 99.35%), vegetables and vegetable products (94.39% and 94.92%), breakfast cereals (93.55% and 93.55%), cereal grains and pasta (90.24% and 90.24%), spices and herbs (88.71% and 88.71%), beverages (85.99% and 89.25%), and legumes and legume products (75.07% and 78.43%) had the highest averages (%) of cholesterol free and low cholesterol foods. Foods containing appropriate cholesterol levels were not found or were very few in eight food groups (lamb, veal, and game products; poultry products; pork products; beef products; finfish and shellfish products; sausages and luncheon meats; fast foods; restaurant foods). In general, the cholesterol free and low cholesterol claims were not met in meat-containing foods, egg yolk-containing foods, and fat- or oil-containing foods. However, these claims were met in foods containing small amounts of meat, egg yolk, fat, or oil. Meats (such as beef, veal, lamb, mutton, pork, poultry, finfish, shellfish, and meat from other species), egg yolks, fats, and oils of animal origin contained cholesterol and saturated fat, and fats and oils of plant origin contained saturated fat.

On the basis of the proposed method, the averages (%) of energy free and low energy foods in food groups were 1.76% and 22.54%, respectively. Vegetables and vegetable products (4.13% and 81.65%), spices and herbs (10.77% and 81.54%), soups, sauces, and gravies (4.6% and 60.61%), fruits and fruit juices (1.95% and 51.25%), and beverages (19.73% and 45.68%) had the highest averages (%) of energy free and low energy foods. In general, the energy free and low energy claims were not met in foods containing large amounts of carbohydrate, protein, fat or oil, or alcohol. Foods containing appropriate energy levels were not found or were very few in 11 food groups (meals, entrees, and side dishes; breakfast cereals; poultry products; beef products; restaurant foods; baked products; lamb, veal, and game products; snacks; fast foods; pork products; cereal grains and pasta).
About 95.7% of foods contained fat. On the basis of the proposed method, the averages (%) of fat free and low fat foods in food groups were 15.73% and 44.35%, respectively. Cereal grains and pasta with 98.34%, fruits and fruit juices with 97.49%, vegetables and vegetable products with 92.59%, beverages with 91.08%, breakfast cereals with 88.92%, spices and herbs with 69.23%, soups, sauces, and gravies with 68.49%, American Indian/Alaska Native foods with 59.06%, legumes and legume products with 57.49%, finfish and shellfish products with 57.36%, sweets with 51.2%, and baby foods with 47.12% had the highest averages (%) of low fat foods. In contrast, restaurant foods with 2.17%, fast foods with 4.64%, fats and oils with 6.82%, beef products with 7.28%, sausages and luncheon meats with 12.94%, pork products with 14.66%, and lamb, veal, and game products with 15.95% had the lowest averages (%) of low fat foods.
About 95% of foods contained saturated fat. On the basis of the proposed method, the averages (%) of saturated fat free and low saturated fat foods in food groups were 18.84% and 44.67%, respectively. Cereal grains and pasta with 98.28%, fruits and fruit juices with 97.47%, vegetables and vegetable products with 94.33%, breakfast cereals with 93.71%, beverages with 88.67%, spices and herbs with 81.25%, legumes and legume products with 77.41%, and finfish and shellfish products with 63.67% had the highest averages (%) of low saturated fat foods. In contrast, beef products with 1.15%, fast foods with 4.64%, pork products with 5.01%, restaurant foods with 5.43%, lamb, veal, and game products with 9.35%, sausages and luncheon meats with 10.18%, fats and oils with 15.45%, and poultry products with 19.07% had the lowest averages (%) of low saturated fat foods. In general, fats and oils (in the form of pure fats and oils or foods containing fat or oil), meats (such as beef, veal, lamb, mutton, pork, poultry, finfish, shellfish, and meat from other species), and egg yolks contained saturated fat. However, the saturated fat content in them was different.
About 97.7% of foods contained sodium. On the basis of the proposed method, the averages (%) of sodium free, very low sodium, and low sodium foods in food groups were 21.31%, 38.12%, and 55.47%, respectively. Beef products with 98.96%, fruits and fruit juices with 98.88%, lamb, veal, and game products with 95.02%, baby foods with 92.6%, nut and seed products with 89.05%, cereal grains and pasta with 87.85%, sweets with 84.13%, spices and herbs with 83.08%, and beverages with 79.36% had the highest averages (%) of low sodium foods. In contrast, meals, entrees, and side dishes with 1.14%, sausages and luncheon meats with 1.76%, fast foods with 2.03%, restaurant foods with 3.26%, soups, sauces, and gravies with 3.28%, baked products with 24.35%, and breakfast cereals with 26.14% had the lowest averages (%) of low sodium foods. Most foods containing inappropriate sodium levels were allocated to foods containing added sodium.
About 69.3% of foods contained sugars. On the basis of the proposed method, the averages (%) of sugar free and low sugar foods in food groups were 42.14% and 73.46%, respectively. Beef products with 100%, cereal grains and pasta with 100%, finfish and shellfish products with 100%, lamb, veal, and game products with 100%, pork products with 100%, poultry products with 100%, sausages and luncheon meats with 100%, fats and oils with 97.92%, spices and herbs with 97.62%, nut and seed products with 91.67%, and vegetables and vegetable products with 89.18% had the highest averages (%) of low sugar foods. In contrast, fruits and fruit juices with 9.12%, sweets with 12.01%, baby foods with 27.93%, breakfast cereals with 28.9%, beverages with 39.27%, baked products with 48.34%, and snacks with 56.69% had the lowest averages (%) of low sugar foods. Most foods containing inappropriate sugars levels were allocated to foods containing added sugars.

References:
Forouzesh, Abed; Forouzesh, Fatemeh; Samadi Foroushani, Sadegh; Forouzesh, Abolfazl. A new method for calculating cholesterol and saturated fat contents and determining appropriate cholesterol levels in foods. SSRN 2022. DOI: 10.2139/ssrn.4131337
Forouzesh, Abed; Forouzesh, Fatemeh; Samadi Foroushani, Sadegh; Forouzesh, Abolfazl. A new method for calculating energy content and determining appropriate energy levels in foods. SSRN 2022. DOI: 10.2139/ssrn.4132581
Forouzesh, Abed; Forouzesh, Fatemeh; Samadi Foroushani, Sadegh; Forouzesh, Abolfazl. A new method for calculating fat content and determining appropriate fat levels in foods. Iran J Public Health 2023;52:1038–1047. DOI: 10.18502/ijph.v52i5.12722
Forouzesh, Abed; Forouzesh, Fatemeh; Samadi Foroushani, Sadegh; Forouzesh, Abolfazl. A new method for calculating saturated fat content and determining appropriate saturated fat levels in foods. SSRN 2022. DOI: 10.2139/ssrn.4133571
Forouzesh, Abed; Forouzesh, Fatemeh; Samadi Foroushani, Sadegh; Forouzesh, Abolfazl. A new method for calculating sodium content and determining appropriate sodium levels in foods. SSRN 2022. DOI: 10.2139/ssrn.4133574

Forouzesh, Abed; Forouzesh, Fatemeh; Samadi Foroushani, Sadegh; Forouzesh, Abolfazl. A new method for calculating sugars content and determining appropriate sugars levels in foods. SSRN 2022. DOI: 10.2139/ssrn.4133577
Date
Source Own work
Author SSamadi15

Licensing[edit]

I, the copyright holder of this work, hereby publish it under the following license:
w:en:Creative Commons
attribution share alike
This file is licensed under the Creative Commons Attribution-Share Alike 4.0 International license.
You are free:
  • to share – to copy, distribute and transmit the work
  • to remix – to adapt the work
Under the following conditions:
  • attribution – You must give appropriate credit, provide a link to the license, and indicate if changes were made. You may do so in any reasonable manner, but not in any way that suggests the licensor endorses you or your use.
  • share alike – If you remix, transform, or build upon the material, you must distribute your contributions under the same or compatible license as the original.

File history

Click on a date/time to view the file as it appeared at that time.

Date/TimeThumbnailDimensionsUserComment
current14:21, 2 November 2023Thumbnail for version as of 14:21, 2 November 20234,964 × 7,020 (3.17 MB)SSamadi15 (talk | contribs)Uploaded own work with UploadWizard

There are no pages that use this file.

Metadata