Category:Weather reanalysis
Jump to navigation
Jump to search
Subcategories
This category has the following 2 subcategories, out of 2 total.
E
- ECMWF ERA-40 (2 F)
- ECMWF ERA5 (2 F)
Media in category "Weather reanalysis"
The following 39 files are in this category, out of 39 total.
-
 1915 Atlantic hurricane season reanalysis1.jpg 1,799 × 1,351; 533 KB
-
 1916 Atlantic hurricane season reanalysis1.jpg 1,799 × 1,351; 587 KB
-
 1917 Atlantic hurricane season reanalysis1.jpg 1,799 × 1,351; 515 KB
-
 1918 Atlantic hurricane season reanalysis.jpg 1,522 × 1,185; 1,017 KB
-
 1918 Atlantic hurricane season reanalysis1.jpg 1,799 × 1,351; 506 KB
-
 1919 Atlantic hurricane season reanalysis1.jpg 1,799 × 1,351; 501 KB
-
 1920 Atlantic hurricane season reanalysis1.jpg 1,799 × 1,351; 504 KB
-
 2014-01-03 North American cold wave.png 1,920 × 1,080; 661 KB
-

-
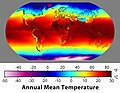 Annual Average Temperature Map.jpg 1,100 × 849; 385 KB
-
 AO Temperature.png 2,508 × 2,654; 2.47 MB
-
 ERAI.png 1,614 × 1,180; 295 KB
-
 Euro1963-jan.feb.png 465 × 414; 20 KB
-
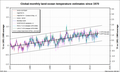
 Global monthly temperature record.png 1,065 × 640; 130 KB
-
 Global monthly temps closeup.png 1,065 × 640; 139 KB
-
 HDW index Pagami.png 858 × 647; 223 KB
-
 JanArcticSfcT.svg 778 × 720; 518 KB
-
 JulArcticSfcT.svg 778 × 720; 472 KB
-
 Maggie 1999 C-K pressure analysis.png 942 × 708; 26 KB
-
 MonthlyMeanT.gif 550 × 340; 405 KB
-
 Mslp-jja-djf.png 652 × 674; 24 KB
-
 Ncep omeganomalies over kerala.pdf 2,102 × 666; 472 KB
-
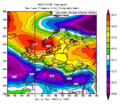
 NOAA JulAug2013Temp.jpg 610 × 458; 165 KB
-
 North Atlantic Hurricane History.png 800 × 497; 66 KB
-
 North Pacific Oscillation.png 1,636 × 1,158; 695 KB
-
 NWS-NOAA Omega wind heatwave June 28-July 4, 2015.jpg 610 × 490; 286 KB
-
 Olga 1999 C-K pressure analysis.png 942 × 708; 27 KB
-
 Pakistan cyclone 2015 04 26 00UTC.png 1,012 × 754; 416 KB
-
 Paul 1999 C-K pressure analysis.png 942 × 708; 27 KB
-
 Relativevorticityanomalies3.pdf 1,391 × 943; 832 KB
-
 Sam 1999 C-K pressure analysis.png 942 × 708; 27 KB
-
 Tanya 1999 C-K pressure analysis.png 942 × 708; 30 KB
-
 Typhoon Mawar 2005 computer simulation thumbnail.gif 450 × 403; 869 KB
-
 Typhoon Mawar 2005 computer simulation.gif 1,380 × 1,235; 4.41 MB
-
 United States 2 Meter Temperatures and Wind Vectors January 18, 1994.png 932 × 543; 422 KB
-
 Upper Midwest MERRA-2 Reanalysis January 18, 1994.png 938 × 543; 267 KB
-
 Virgil 1999 C-K pressure analysis.png 942 × 708; 30 KB
-
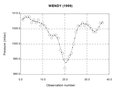 Wendy 1999 C-K pressure analysis.png 942 × 708; 30 KB
-
 York 1999 C-K pressure analysis.png 942 × 708; 33 KB


_pattern._October_9-21,_2010_daily_average.jpg)


