Category:Water maps of the world
Jump to navigation
Jump to search
Subcategories
This category has the following 2 subcategories, out of 2 total.
W
Media in category "Water maps of the world"
The following 29 files are in this category, out of 29 total.
-
 2014-09-countries.png 1,006 × 576; 137 KB
-
 Ballast Water Management Convention map.svg 2,754 × 1,398; 1.15 MB
-
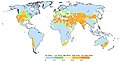
 Baseline water stress.jpg 1,027 × 710; 789 KB
-

-
 Disponibilite eau douce carte 2000.png 1,350 × 625; 34 KB
-

-
 Global Water Security.jpg 1,024 × 696; 794 KB
-
 London Convention signatories.png 1,350 × 625; 48 KB
-
 Map of water treatment by countries.png 1,350 × 625; 62 KB
-
 MARPOL 73-78 signatories.png 1,350 × 625; 48 KB
-
 North Pacific Gyre World Map.png 1,200 × 784; 1.37 MB
-
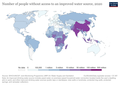 Number-without-improved-water 2020.png 3,400 × 2,400; 773 KB
-
 Obnovitelné zdroje vody.jpg 601 × 362; 28 KB
-
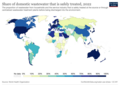
 Population in survey regions living without safely managed drinking water.webp 2,128 × 1,990; 464 KB
-
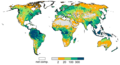
 Renewable Groundwater Resources in mm per year By WaterGAP Average 1961-1990.jpg 1,540 × 768; 207 KB
-
 Share-deaths-unsafe-water.png 3,400 × 2,400; 773 KB
-
-
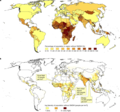
 Total Renewable Freshwater Resources in mm per year By WaterGAP Average 1961-1990.jpg 3,200 × 1,580; 564 KB
-
 Total Renewable GroundwaterResources by WaterGAP in mm per year.png 2,300 × 1,250; 80 KB
-
 Total Water Withdrawals in mm per year By WaterGAP Average 1998-2002.jpg 3,360 × 1,860; 456 KB
-

-
 Wastewater-safely-treated.png 3,400 × 2,400; 834 KB
-
 Water Consumption (5456652307).jpg 3,174 × 2,354; 677 KB
-
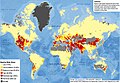
 Water erosion map.png 3,400 × 2,200; 2.01 MB
-
 Water Footprint per capita-es.png 1,465 × 2,400; 2.18 MB
-
 Water Footprint per capita.jpg 1,500 × 2,457; 723 KB
-
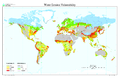
 Water Stress Around 2000 A.D. By WaterGAP.jpg 1,540 × 800; 134 KB
-
 Water-productivity.png 3,400 × 2,400; 815 KB
-
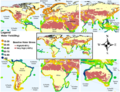
 World map of the aggregated global water security index (early 2010s).jpg 1,720 × 779; 901 KB


,_2002%E2%80%932016_(48009168058).jpg)

.jpg)


.jpg)