Category:Valid SVG created with Inkscape-hand:Charts
Jump to navigation
Jump to search
Media in category "Valid SVG created with Inkscape-hand:Charts"
The following 28 files are in this category, out of 28 total.
-
 15% pie chart.svg 30 × 30; 329 bytes
-
 20% pie chart.svg 30 × 30; 331 bytes
-
 2011 Umweltbundesamt Quecksilberemissionen ÖKOPOL-Grafik.svg 512 × 428; 3 KB
-
 2013-UN-Report Global-Mercury-Emissions 2010 ÖKOPOL-Grafik.svg 512 × 413; 4 KB
-
 25% pie chart.svg 30 × 30; 213 bytes
-
 30% pie chart.svg 30 × 30; 331 bytes
-
 35% pie chart.svg 30 × 30; 331 bytes
-
 40% pie chart.svg 30 × 30; 330 bytes
-
 45% pie chart.svg 30 × 30; 330 bytes
-
 5% pie chart.svg 30 × 30; 329 bytes
-
 50% pie chart.svg 30 × 30; 329 bytes
-
 55% pie chart.svg 30 × 30; 331 bytes
-
 60% pie chart.svg 30 × 30; 331 bytes
-
 65% pie chart.svg 30 × 30; 332 bytes
-
 70% pie chart.svg 30 × 30; 332 bytes
-
 75% pie chart.svg 30 × 30; 330 bytes
-
 80% pie chart.svg 30 × 30; 332 bytes
-
 85% pie chart.svg 30 × 30; 330 bytes
-
 90% pie chart.svg 30 × 30; 330 bytes
-
 95% pie chart.svg 30 × 30; 330 bytes
-
 Altitudinal zones of the Alps.svg 943 × 880; 7 KB
-
 Aléas-enjeux-risques.svg 467 × 674; 2 KB
-
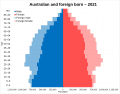 Australian and foreign born population pyramid in 2021.svg 2,693 × 2,098; 54 KB
-
 EM-Spektrum.svg 787 × 421; 5 KB
-
 Tachocline.svg 300 × 300; 3 KB
-
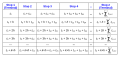 Transit timetable.svg 512 × 244; 7 KB
-

-
 World potential GDP benefit under net zero by 2050 (IMF).svg 835 × 600; 11 KB


.svg)