Category:Valid SVG created with Gnuplot:Diagrams
Jump to navigation
Jump to search
Subcategories
This category has only the following subcategory.
Media in category "Valid SVG created with Gnuplot:Diagrams"
The following 23 files are in this category, out of 23 total.
-
 1sphere.svg 800 × 520; 192 KB
-
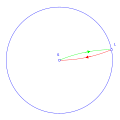
 BornChartNullGeodesic.svg 400 × 400; 101 KB
-
 BornChartNullGeodesicsLangevinObservers.svg 400 × 400; 71 KB
-
 BornChartRadialNullGeodesicsInboundOutbound.svg 400 × 400; 40 KB
-
 Catstats.svg 777 × 480; 145 KB
-
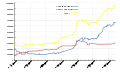
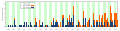
 COVID-19-Pandemie - AT (Österreich) - Infizierte (800px).svg 800 × 450; 482 KB
-
 COVID-19-Pandemie - CH (Schweiz) - Infizierte (800px).svg 800 × 450; 488 KB
-
 COVID-19-Pandemie - DK (Dänemark) - Infizierte (800px).svg 800 × 450; 485 KB
-
 COVID-19-Pandemie - FR (Frankreich) - Infizierte (800px).svg 800 × 450; 474 KB
-
 COVID-19-Pandemie - GB (Vereinigtes Königreich) - Infizierte (800px).svg 800 × 450; 481 KB
-
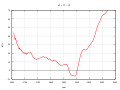 Delta T 1657-2022.svg 640 × 480; 33 KB
-
 Gexp perturbation potential.svg 800 × 600; 13 KB
-
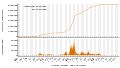
 Glacier quake abundance Greenland 1993-2013 columns.svg 1,362 × 350; 109 KB
-
-
 Klimadiagramm hadley 1850 2009.svg 1,000 × 700; 39 KB
-
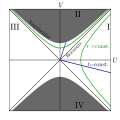 KruskalSzekeres.svg 620 × 620; 51 KB
-
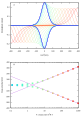 Laviron2.svg 550 × 800; 253 KB
-
 Lissajous curve 1by2.svg 600 × 600; 2 KB
-
 Moonrises sets and phases berlin 03 2018.svg 800 × 350; 73 KB
-
 Sinc wolfram.svg 800 × 600; 37 KB
-
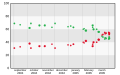
 Trend of crystal structures in databases.svg 1,024 × 798; 10 KB
-
 TT-UT1 2000+.svg 640 × 480; 89 KB
-


_-_Infizierte_(800px).svg)
_-_Infizierte_(800px).svg)
_-_Infizierte_(800px).svg)
_-_Infizierte_(800px).svg)
_-_Infizierte_(800px).svg)


.svg)


