Category:Sea level statistics
Jump to navigation
Jump to search
Media in category "Sea level statistics"
The following 63 files are in this category, out of 63 total.
-
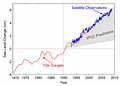
 1991 IPCC sea level rise estimate and observation.png 800 × 500; 19 KB
-
 20190708 Stripe graphic of sea level change (1880-2013) Richard Selwyn Jones.png 3,200 × 1,800; 56 KB
-
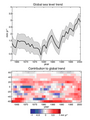
 Alt gmsl seas not rem.jpg 700 × 500; 142 KB
-
 Alt gmsl seas not rem.svg 800 × 540; 59 KB
-
 Alt gmsl seas rem.jpg 700 × 500; 136 KB
-
 Climate-change 70ma.png 1,035 × 787; 115 KB
-
 Evolution-of-GMSL-time-series-from-six-different-groups’.jpg 940 × 639; 68 KB
-
 Global Mean Sea Level.svg 1,000 × 650; 300 KB
-
 Global sea level rise from 1992 to 2020, satellite data chart.svg 800 × 540; 59 KB
-
 Gornitz(2007).jpg 574 × 587; 34 KB
-
 Historique et projections du niveau de la mer.svg 960 × 720; 9 KB
-
 Holocene Niveau Mer.png 512 × 364; 16 KB
-
 Holocene Sea Level-es.svg 512 × 364; 31 KB
-
 Holocene Sea Level-fr.svg 512 × 364; 25 KB
-
 Holocene Sea Level.png 512 × 364; 22 KB
-
 Kopp2016 sealevel increaseByCentury de.svg 1,000 × 600; 33 KB
-
 Kopp2016 sealevel increaseByCentury en.svg 1,000 × 600; 33 KB
-
 Meeresspiegelanstieg Satelliten.png 1,192 × 721; 48 KB
-
 Meeresspiegelanstieg.png 1,616 × 443; 72 KB
-
 NASA-Satellite-sea-level-rise-observations.jpg 1,000 × 813; 113 KB
-
 Phanerozoic Sea Level ca.svg 523 × 360; 35 KB
-
 Phanerozoic Sea Level es.svg 523 × 360; 35 KB
-
 Phanerozoic Sea Level i18n.png 1,440 × 847; 73 KB
-
 Phanerozoic Sea Level-fr.svg 523 × 360; 24 KB
-
 Phanerozoic Sea Level.png 523 × 360; 23 KB
-
 Phanerozoic Sea Level.svg 523 × 360; 34 KB
-
 Post-Glacial Sea Level-fr.svg 526 × 359; 24 KB
-
 Post-Glacial Sea Level.png 1,813 × 1,088; 371 KB
-
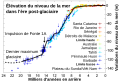
 Postglacial Sea level Rise Curve and Meltwater Pulses (MWP).jpg 783 × 800; 74 KB
-

-
 Projections of global mean sea level rise by Parris et al. (2012) NO.png 1,355 × 761; 95 KB
-
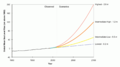
 Projections of global mean sea level rise by Parris et al. (2012)-es.png 1,355 × 761; 53 KB
-
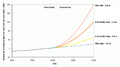
 Projections of global mean sea level rise by Parris et al. (2012).png 1,355 × 761; 34 KB
-
 Recent Sea Level Rise fr.png 800 × 616; 85 KB
-
 Recent Sea Level Rise German.png 537 × 373; 44 KB
-
 Recent Sea Level Rise-fi.png 800 × 561; 111 KB
-
 Recent Sea Level Rise-template.png 800 × 561; 103 KB
-
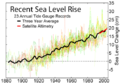 Recent Sea Level Rise.png 537 × 373; 47 KB
-

-
 Sea air chart 2008.png 525 × 426; 32 KB
-
 Sea level history and projections-cs.svg 512 × 384; 13 KB
-
 Sea level history and projections-da.svg 960 × 720; 5 KB
-
 Sea level history and projections-vi.svg 960 × 720; 16 KB
-
 Sea level history and projections.svg 960 × 720; 5 KB
-
 Sea level rise projections for the 21st century.png 827 × 874; 17 KB
-
 Sea level rise.svg 1,101 × 752; 62 KB
-
 Sea level temp 140ky Quaternary-fr.svg 530 × 340; 25 KB
-
 Sea level temp 140ky.gif 530 × 340; 22 KB
-
 Sealevel-rise 1870-2009 de.svg 610 × 518; 113 KB
-
 Sealeveldutch.png 630 × 443; 49 KB
-
 Slr prediction med.jpg 2,088 × 1,488; 330 KB
-
 Stijging zeeniveau.svg 600 × 480; 35 KB
-
 Strandlinjekurve for den sørlige delen av Østfold, Norge.JPG 835 × 637; 335 KB
-

-

-
 STRANDLINJEKURVE før øya AUKRA i Møre og Romsdal i Norge.jpg 694 × 579; 66 KB
-
 Tdgage.png 446 × 597; 51 KB
-
 The Rising Sea Level.jpg 1,150 × 750; 122 KB
-
 Trends in global average absolute sea level, 1870-2008 (US EPA).png 670 × 717; 61 KB
-
 Trends in global average absolute sea level, 1880-2013.png 928 × 803; 112 KB
-
 U. S. Sea Level Trends 1900-2003.gif 340 × 439; 11 KB
-
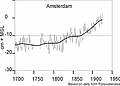 Waterstanden te Amsterdam 1700-1932.jpg 478 × 341; 31 KB
-
 Zeespiegelstijging 1993-nu.png 918 × 755; 104 KB

_Richard_Selwyn_Jones.png)


.jpg)


.jpg)
.png)
_NO.png)
-es.png)
.png)


.gif)


.png)


