Category:SVG ecology
Jump to navigation
Jump to search
Media in category "SVG ecology"
The following 81 files are in this category, out of 81 total.
-
 A generic ecological pyramid ml.svg 598 × 451; 8 KB
-
 Air pollution.svg 288 × 213; 1.04 MB
-
 Aquarium Nitrogen Cycle tr.svg 601 × 383; 22 KB
-
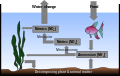 Aquarium Nitrogen Cycle.svg 601 × 383; 25 KB
-
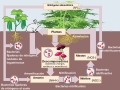
 Biochem.svg 425 × 378; 81 KB
-
 Biofuels.svg 260 × 192; 114 KB
-
 Biogeochem.svg 425 × 378; 50 KB
-
 Carbon cycle-cute diagram ar.svg 540 × 417; 118 KB
-
 Carbon cycle-cute diagram da.svg 540 × 417; 151 KB
-
 Carbon cycle-cute diagram ta.svg 540 × 417; 152 KB
-
 Carbon cycle-cute diagram zh-hant.svg 540 × 417; 339 KB
-
 Carbon cycle-cute diagram-german.svg 540 × 417; 249 KB
-
 Carbon cycle-cute diagram-no.svg 512 × 393; 97 KB
-
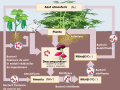
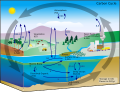 Carbon cycle-cute diagram.svg 600 × 460; 65 KB
-
 Carbon cycle-simple diagram-pt.svg 847 × 675; 59 KB
-
 Carbon cycle-simple diagram.svg 423 × 337; 60 KB
-
 Cicle del nitrogen ca.svg 800 × 600; 143 KB
-
 Cicle del nitrogen de.svg 800 × 600; 55 KB
-
 Cicle del nitrogen es.svg 800 × 600; 1.14 MB
-
 Ciclo dell'azoto in un acquario.svg 601 × 383; 23 KB
-
 CO2 responsibility 1950-2000.svg 940 × 477; 1.98 MB
-
 Cycle azote fr.svg 800 × 600; 1.14 MB
-
 Deforestation.svg 213 × 213; 1.29 MB
-
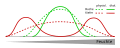
 Drapieżnictwo.svg 737 × 384; 14 KB
-
 Ecological pyramid ta.svg 432 × 268; 6 KB
-
 Ecological pyramid-hi.svg 598 × 451; 7 KB
-
 Ecological pyramid.svg 598 × 451; 7 KB
-
 Ecozone-Biocountry-Australasia-2-legend.svg 160 × 357; 114 KB
-
 Energy plant.svg 181 × 191; 15 KB
-
 Eutrophication gl.svg 1,500 × 981; 1.16 MB
-
 FoodChain.svg 744 × 1,052; 733 KB
-
 Garbage dump site.svg 787 × 553; 1.86 MB
-
 Geochem.svg 425 × 378; 44 KB
-
 GHG by country 2000.svg 940 × 477; 1.98 MB
-
 GHG intensity 2000.svg 940 × 477; 1.98 MB
-
 GHG per capita 2000 no LUC.svg 940 × 477; 1.98 MB
-
 GHG per capita 2000.svg 940 × 477; 1.98 MB
-
 Green energy.svg 192 × 213; 28 KB
-
 Klimadiagramm hadley 1850 2009.svg 1,000 × 700; 39 KB
-
 Life-Zones (de).png 2,560 × 1,590; 894 KB
-
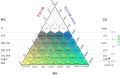
 Lifezones Pengo, by ecology.svg 911 × 569; 186 KB
-
 Lifezones Pengo, by type.svg 911 × 569; 140 KB
-
 Lifezones Pengo, FAO.svg 988 × 615; 136 KB
-
 Lifezones Pengo, IRI.svg 988 × 613; 144 KB
-
 Lifezones Pengo, TSMF.svg 986 × 613; 198 KB
-
 Lifezones Pengo-KO.svg 987 × 613; 108 KB
-
 Lifezones Pengo.svg 987 × 613; 264 KB
-
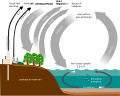
 Nitrogen Cycle ro.svg 800 × 600; 65 KB
-
 No offshore platform.svg 744 × 1,052; 396 KB
-
 Oceanic ecosystemes.svg 1,052 × 744; 22 KB
-
 Oil pollution.svg 173 × 213; 1.15 MB
-
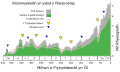 Phanerozoic Biodiversity-CY.svg 784 × 464; 178 KB
-
 Phanerozoic Biodiversity-eo.svg 784 × 464; 204 KB
-
 Phanerozoic Biodiversity-es.svg 784 × 464; 204 KB
-
 Phanerozoic Biodiversity-pt BR.svg 784 × 464; 204 KB
-
 Phanerozoic Biodiversity-pt PT.svg 784 × 464; 204 KB
-
 Phanerozoic Biodiversity-sl.svg 784 × 464; 145 KB
-
 Phanerozoikums biodiversitet-da.svg 784 × 464; 145 KB
-
-
 Pioneer species colonization leading to primary sucession.svg 512 × 221; 227 KB
-
 Population distribution.svg 313 × 655; 51 KB
-
 Save water.svg 217 × 213; 1.1 MB
-
 Schema eolienne.svg 393 × 425; 35 KB
-
 Scheme eutrophication cs.svg 1,485 × 955; 1.13 MB
-
 Scheme eutrophication-en.svg 1,485 × 955; 1.16 MB
-
 Sewer system leak.svg 1,018 × 722; 133 KB
-
 Speciation modes bg.svg 350 × 320; 38 KB
-
 Speciation modes edit af.svg 350 × 320; 43 KB
-
 Speciation modes edit NL.svg 350 × 320; 42 KB
-
 Speciation modes edit.svg 350 × 320; 37 KB
-
 Speciation modes sl.svg 350 × 320; 38 KB
-
 Speciation modes-ar.svg 350 × 320; 238 KB
-
 Speciation modes-es.svg 400 × 320; 29 KB
-
 Speciation modes-he.svg 350 × 320; 153 KB
-
 Speciation modes-ru.svg 458 × 319; 32 KB
-
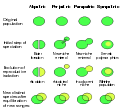 Speciation modes.svg 350 × 320; 37 KB
-
 Tylosaurus gut contents (SDSM 10439).svg 1,255 × 1,689; 1.5 MB
-
 Voedselweb.svg 400 × 220; 119 KB
-
 Water pollution.svg 245 × 213; 1.38 MB
-
 Wind turbine blank.svg 300 × 1,000; 17 KB
-
 Windkraftanlage.svg 512 × 833; 29 KB


.png)


.svg)


