Category:RCraig09 charts showing data through 2018
Jump to navigation
Jump to search
English: Charts uploaded by User:RCraig09 showing data through 2018—used for tracking which charts may be due for updating.
Media in category "RCraig09 charts showing data through 2018"
The following 21 files are in this category, out of 21 total.
-
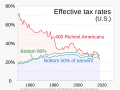 1960- Tax rates of richest versus low income people - US.svg 1,000 × 750; 6 KB
-
 1970- Decline in species populations - Living Planet Index.svg 1,200 × 675; 6 KB
-
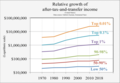 1970- Relative income growth by percentiles - US logarithmic.png 1,636 × 1,132; 237 KB
-
 1970- Relative income growth by percentiles - US.png 1,636 × 1,132; 57 KB
-
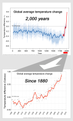 2,000- and 139-year global average temperature.png 2,750 × 4,530; 547 KB
-
 2017 Global warming attribution - based on NCA4 Fig 3.3.png 3,193 × 4,500; 260 KB
-
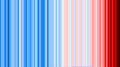
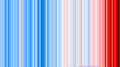 20190704 Warming stripes - HadCRUT.4.6.0.0 - world.png 3,200 × 1,800; 39 KB
-
-
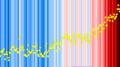 20190705 Warming stripes BEHIND line graph - Berkeley Earth (world).png 3,200 × 1,800; 621 KB
-

-

-
 20190707 Compare warming stripes - three reference periods.png 3,200 × 1,800; 97 KB
-
 20190709 Compare warming stripes - 0.10 vs 0.15 C per color.png 3,200 × 1,800; 220 KB
-
-
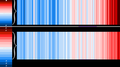
 20190725 COMPARE Warming stripes - N vs S hemispheres 1880-2018 (ref 1901-2000).png 3,200 × 1,800; 75 KB
-
 20190727 COMPARE warming stripes - Global vs Caribbean 1910-2018 (ref 1910-2000).png 3,200 × 1,800; 68 KB
-
 20190907 STACKED global warming stripes (large legends) - derived from Ed Hawkins.png 3,000 × 4,000; 1.12 MB
-
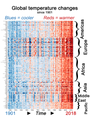
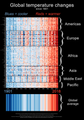 20190909 STACKED country warming stripes AND global average (1901- ).png 3,500 × 5,000; 1,011 KB
-
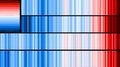
 20190912 Stacked warming stripes - atmospheric layers (derived from Ed Hawkins).png 4,116 × 2,392; 122 KB
-
 800,000-, 2,000-, 139-year global average temperature.png 3,000 × 7,000; 2.31 MB
-
 8000 BCE+ Loss of forest and grassland to grazing and crops.svg 1,200 × 675; 3 KB


_-_avg_above-_and_below-ice_readings.png)
.png)
_vs_World_(Berkeley_Earth_1850-2018).png)


.png)
.png)
.png)
_-_derived_from_Ed_Hawkins.png)
.png)
.png)

