Category:Population growth maps of the United States
Jump to navigation
Jump to search
Media in category "Population growth maps of the United States"
The following 16 files are in this category, out of 16 total.
-
 % Population Change by state from 2010 - 2019.png 5,175 × 3,762; 1.2 MB
-
 % Population Chnge by state from 2010 - 2017.png 5,400 × 3,586; 883 KB
-
 2000-census-numeric-change.png 1,584 × 1,224; 266 KB
-
 2000-census-percent-change.png 1,584 × 1,224; 311 KB
-
 Annual population growth in the U.S. by county - 2010s.png 7,500 × 4,000; 5.07 MB
-
 Annual population growth rate by U.S. state.svg 1,199 × 593; 75 KB
-
 Census Bureau population change in the United States 1960-2000.jpg 626 × 391; 53 KB
-
 Evol pop USA 2000-2007.png 2,500 × 2,116; 823 KB
-
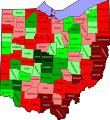 Ohio change in population by county 2010 to 2020.svg 3,675 × 3,995; 154 KB
-
 Percent Population change by state from 2010 - 2020.svg 1,000 × 593; 75 KB
-
 Popchange.png 800 × 526; 55 KB
-
 U.S. states' population change from 2010 to 2013.svg 1,000 × 630; 52 KB
-
 US counties by population growth.png 1,513 × 983; 206 KB
-
 US population birth, death, and growth rates since 2000.jpg 760 × 527; 37 KB
-
 US population growth rates since 1900.jpg 736 × 436; 26 KB
-
 US states by population change.png 1,052 × 654; 91 KB


