Category:Our World in Data - Population and Demographic Change
Jump to navigation
Jump to search
Media in category "Our World in Data - Population and Demographic Change"
The following 195 files are in this category, out of 195 total.
-
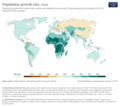
 Absolute increase in global population per year, OWID.svg 850 × 600; 10 KB
-
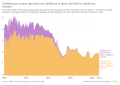
 Age dependency breakdown by young and old dependents, OWID.svg 850 × 600; 22 KB
-
 Age dependency ratio projected to 2100, OWID.svg 850 × 600; 23 KB
-
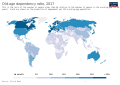
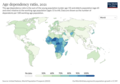 Age Dependency Ratio, 2021.png 1,462 × 1,026; 315 KB
-
 Age dependency ratio, OWID.svg 850 × 600; 154 KB
-
 Annual number of births by world region, OWID.svg 850 × 600; 20 KB
-
 Annual number of deaths by world region, OWID.svg 850 × 600; 20 KB
-
 Annual World Population Since 10,000 BC.png 2,674 × 1,881; 209 KB
-
 Annual-World-Population-since-10-thousand-BCE-1-768x724.png 747 × 677; 111 KB
-

-
 Average number of children vs child mortality, OWID.svg 850 × 600; 38 KB
-

-
 Birth and Death Rates.png 1,656 × 1,048; 176 KB
-
 Birth rate vs Death rate, OWID.svg 850 × 600; 41 KB
-

-
 Burundi-Demography.png 3,400 × 2,400; 294 KB
-
 By age group- The growth of the population to 2100, OWID.svg 850 × 600; 31 KB
-

-
 Children born per woman, OWID.svg 850 × 600; 148 KB
-
 Children per woman (fertility rate) vs. level of prosperity, OWID.svg 850 × 600; 114 KB
-
 Children per woman (UN; 1950 to 2015), OWID.svg 850 × 600; 141 KB
-
 Children per woman by GDP per capita, OWID.svg 850 × 600; 34 KB
-
-
 Children per woman vs population growth, OWID.svg 850 × 600; 43 KB
-
 Children per woman vs. Human Development Index, OWID.svg 850 × 600; 35 KB
-
 Children per woman, 1, OWID.svg 850 × 600; 101 KB
-
 Children per woman, OWID.svg 850 × 600; 12 KB
-

-
 City population, OWID.svg 850 × 600; 5 KB
-

-
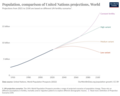 Comparison-of-world-population-projections.png 3,400 × 2,706; 552 KB
-
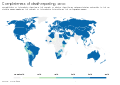
 Completeness of birth registration.png 3,400 × 2,400; 808 KB
-
 Completeness of death reporting, OWID.svg 850 × 600; 140 KB
-
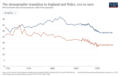
 Demographic-Transition-5-countries.png 2,999 × 2,025; 413 KB
-
 Demographic-TransitionOWID.png 2,364 × 1,875; 258 KB
-
-
 Do more people live in urban or rural areas ? 2022.svg 850 × 600; 167 KB
-
 Do more people live in urban or rural areas., OWID.svg 850 × 600; 139 KB
-

-

-
 European urban population shares from 1500-1980, OWID.svg 850 × 600; 13 KB
-
 Fertility and female labor force participation, OWID.svg 850 × 600; 100 KB
-
 Fertility and wanted fertility, OWID.svg 850 × 600; 11 KB
-
 Fertility rate over the long-term, OWID.svg 850 × 600; 140 KB
-
 Fertility rate vs the share living in extreme poverty, OWID.svg 850 × 600; 28 KB
-
 Fertility rate vs. contraceptive prevalence, OWID.svg 850 × 600; 12 KB
-
 Fertility rate vs. mean years of schooling, OWID.svg 850 × 600; 24 KB
-
 Fertility vs wanted fertility, OWID.svg 850 × 600; 19 KB
-

-

-

-

-

-

-

-
 Global population cartogram.png 8,192 × 3,131; 1.01 MB
-
 Global Population-Pyramid-1950-to-2100.jpg 3,000 × 2,082; 3.47 MB
-
 Global-land-use-since-10000bc (OWID 0541).png 850 × 600; 52 KB
-
 Global-land-use-since-1000bc (OWID 0540).png 850 × 600; 53 KB
-
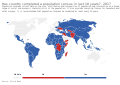 Has country completed a population census in last 10 years., OWID.svg 850 × 600; 138 KB
-
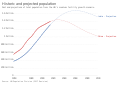 Historic and projected population, OWID.svg 850 × 600; 13 KB
-

-
 Illustration of past, present and future population sizes (Our World in Data).png 1,781 × 2,418; 2.51 MB
-
 International migrant stock, OWID.svg 850 × 600; 140 KB
-

-
 Life expectancy (World Bank data), OWID.svg 850 × 600; 140 KB
-
 Life expectancy (years) vs. Real GDP per capita (2011US$), OWID.svg 850 × 600; 32 KB
-

-
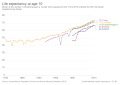 Life expectancy at age 10, OWID.svg 850 × 600; 14 KB
-
 Life expectancy at age 15 by sex, OWID.svg 850 × 600; 16 KB
-
 Life expectancy at age 45, OWID.svg 850 × 600; 16 KB
-
 Life Expectancy at birth (OECD data), OWID.svg 850 × 600; 28 KB
-
 Life expectancy at birth by sex, OWID.svg 850 × 600; 17 KB
-
 Life expectancy at birth vs. CO₂ emissions per capita, OWID.svg 850 × 600; 43 KB
-
 Life expectancy at birth, including the UN projections, OWID.svg 850 × 600; 11 KB
-
 Life expectancy by world region, from 1770 to 2018.svg 850 × 600; 42 KB
-
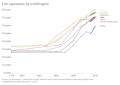 Life expectancy by world region, OWID.svg 850 × 600; 15 KB
-
 Life expectancy in 1800, 1950, and 2015.png 3,000 × 4,323; 1.33 MB
-
 Life expectancy in Armenia and Azerbaija.svg 850 × 600; 39 KB
-
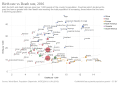
 Life expectancy in North Korea and South Korea.svg 850 × 600; 41 KB
-
 Life expectancy in Serbia and Montenegro.svg 850 × 600; 39 KB
-
 Life expectancy in Spain and Portugal.svg 850 × 600; 42 KB
-
 Life expectancy in Ukraine and Russia.svg 850 × 600; 43 KB
-
 Life expectancy in USA and Canada.svg 850 × 600; 47 KB
-
 Life expectancy of women vs life expectancy of men, OWID.svg 850 × 600; 39 KB
-

-
 Life expectancy vs. GDP per capita, OWID.svg 850 × 600; 33 KB
-
 Life expectancy vs. health expenditure per capita, OWID.svg 850 × 600; 36 KB
-
 Life expectancy vs. health expenditure, OWID.svg 850 × 600; 40 KB
-
 Life expectancy vs. healthcare expenditure, OWID.svg 850 × 600; 40 KB
-
 Life expectancy vs. Liberal Democracy Index, OWID.svg 850 × 600; 35 KB
-
 Life expectancy vs. Political regime, OWID.svg 850 × 600; 34 KB
-
 Life expectancy vs. trust in health professionals, OWID.svg 850 × 600; 29 KB
-
 Life expectancy, OWID.svg 850 × 600; 13 KB
-
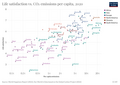
 Life satisfaction vs Life expectancy, OWID.svg 850 × 600; 31 KB
-
 Life satisfaction vs. Child mortality, OWID.svg 850 × 600; 31 KB
-
 Life-expectancy.png 3,400 × 2,706; 643 KB
-
 Life-satisfaction-vs-co-emissions-per-capita (OWID 0575).png 850 × 600; 82 KB
-
 LifeExpectancy2010OneWorldInData.png 860 × 380; 101 KB
-
 Median age vs. children per woman, OWID.svg 850 × 600; 49 KB
-
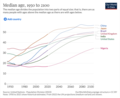 Median Age, 1950-2100.png 1,248 × 1,024; 186 KB
-
 Median Age, OWID.svg 850 × 600; 141 KB
-

-
 Natural population growth (UN (1950 to 2100)), OWID.svg 850 × 600; 140 KB
-
 Net migration, 2012-2016 (Our World in Data).svg 850 × 600; 142 KB
-
 Net migration, OWID.svg 850 × 600; 141 KB
-
 Number of births and deaths per year, OWID.svg 850 × 600; 13 KB
-
 Number of children under 5 years old, OWID.svg 850 × 600; 22 KB
-
 Number of one-year-olds, OWID.svg 850 × 600; 9 KB
-
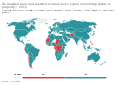
 Number-of-refugees-per-100000.png 3,400 × 2,400; 755 KB
-
 Old-age dependency ratio, OWID.svg 850 × 600; 154 KB
-
 Percentage of Americans living alone (1900-2016), OWID.svg 850 × 600; 12 KB
-
 Percentage of Americans living alone, by age, OWID.svg 850 × 600; 11 KB
-

-
-
 Population (Gapminder and UN (1800 to 2019)), OWID.svg 850 × 600; 18 KB
-
 Population by age bracket with UN projections, OWID.svg 850 × 600; 28 KB
-
 Population by broad age group projected to 2100, OWID.svg 850 × 600; 33 KB
-
 Population by broad age group, OWID.svg 850 × 600; 30 KB
-
 Population by country (Clio Infra (1500 to 2000)), OWID.svg 850 × 600; 16 KB
-
 Population by income level (World Bank), OWID.svg 850 × 600; 13 KB
-
 Population density map of the world.svg 850 × 600; 153 KB
-
 Population density, OWID.svg 850 × 600; 17 KB
-
-
 Population growth rate (UN (1950 to 2100)), OWID.svg 850 × 600; 140 KB
-
 Population growth rate by level of development, OWID.svg 850 × 600; 18 KB
-
 Population growth rate vs Child mortality rate, OWID.svg 850 × 600; 38 KB
-
 Population growth rate vs. median age, OWID.svg 850 × 600; 42 KB
-
 Population growth rate with and without migration, OWID.svg 850 × 600; 11 KB
-
 Population Growth Rates, 2021.png 1,466 × 1,026; 302 KB
-
 Population growth vs child mortality, OWID.svg 850 × 600; 35 KB
-

-

-
 Population projection by the UN, OWID.svg 850 × 600; 141 KB
-
 Population under five years old, OWID.svg 850 × 600; 140 KB
-
 Population younger than 15 years, OWID.svg 850 × 600; 5 KB
-
 Population, OWID.svg 850 × 600; 21 KB
-
 Population-density.png 3,400 × 2,400; 763 KB
-
 Population-growth-rate-vs-median-age (OWID 0826).png 850 × 600; 99 KB
-
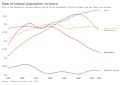
 Population-growth-rates (OWID 0825).png 850 × 600; 98 KB
-

-
 Population-past-future (OWID 0824).png 850 × 600; 79 KB
-
 Population-threshold (OWID 0821).png 850 × 600; 91 KB
-
 Population-unwpp (OWID 0819).png 850 × 600; 48 KB
-
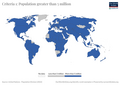
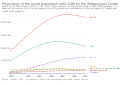
 Predicted-increases-in-population-until-2030 (OWID 0810).png 850 × 600; 50 KB
-
 Projected change in under-5 population from 2015 to 2050, OWID.svg 850 × 600; 140 KB
-
 Projected change in under-5 population from 2050 to 2100, OWID.svg 850 × 600; 140 KB
-
 Projected population by age cohort (UN (2015 to 2100)), OWID.svg 850 × 600; 19 KB
-
 Projected population under age 5, OWID.svg 850 × 600; 24 KB
-
 Projection of the population under 15, by world region, OWID.svg 850 × 600; 19 KB
-

-
-
 Rate of natural population increase (UN), OWID.svg 850 × 600; 24 KB
-
 Refugee population by country or territory of asylum, OWID.svg 850 × 600; 140 KB
-
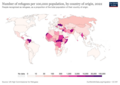
 Refugee population by country or territory of origin, OWID.svg 850 × 600; 140 KB
-
 Sex ratio at birth (Chao et al. (2019)), OWID.svg 850 × 600; 17 KB
-

-
 Sex ratio at birth by birth order, OWID.svg 850 × 600; 16 KB
-
 Sex ratio at birth vs. at five years old, OWID.svg 850 × 600; 37 KB
-
 Sex ratio at birth, OWID.svg 850 × 600; 139 KB
-
 Sex ratio by age, OWID.svg 850 × 600; 15 KB
-
 Sex ratio of five-year-olds, OWID.svg 850 × 600; 140 KB
-
 Share of global CO₂ emissions vs. share of population, OWID.svg 850 × 600; 37 KB
-
 Share of migrants among the population, OWID.svg 850 × 600; 142 KB
-
 Share of students from abroad, OWID.svg 850 × 600; 140 KB
-
 Share of the population that is female, OWID.svg 850 × 600; 140 KB
-
 Share of women ages 15-49 using modern contraceptive methods, OWID.svg 850 × 600; 142 KB
-
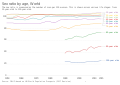
 Size of young, working age and elderly populations, OWID.svg 850 × 600; 12 KB
-
 Size of young, working-age and elderly populations, OWID.svg 850 × 600; 19 KB
-
 Specialist surgical workforce (per 100,000 population), OWID.svg 850 × 600; 142 KB
-
 The Demographic Transition, OWID.svg 850 × 600; 26 KB
-

-
 The growth of the world population to 2100, by age group, OWID.svg 850 × 600; 11 KB
-
-

-
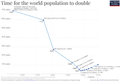 Time for the World population to double 1534 – 2100.png 6,122 × 4,136; 536 KB
-
 Time for the world population to increase by one billion 1805 – 2086.png 2,722 × 2,173; 168 KB
-
 Total fertility rate in 1950 and 2015 (UN), OWID.svg 850 × 600; 101 KB
-

-
 Total World Population – Comparison of different sources, OWID.svg 850 × 600; 10 KB
-
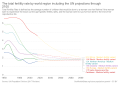
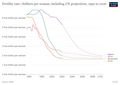 Total-fertility-rate-including-un-projections-through-2100.png 3,400 × 2,400; 465 KB
-
 Women's educational attainment vs. fertility, OWID.svg 850 × 600; 32 KB
-

-

-

-
 World population by region (HYDE (1820 to 2019)), OWID.svg 850 × 600; 23 KB
-
-
 World Population Growth 1700-2100.png 3,057 × 2,179; 244 KB
-
 World population growth, 1700-2100, 2019 revision.png 6,370 × 4,540; 589 KB
-
 World population growth, 1700-2100, 2022 revision.png 13,083 × 9,584; 1.46 MB
-

-
 World population since 10,000 BCE (OurWorldInData series), OWID.svg 850 × 600; 32 KB
-
 World-Population-Growth-1750-2100.png 3,000 × 2,100; 236 KB
-
 Years-it-took-Fertility-to-fall-from-6-to-below-3.png 3,000 × 2,100; 278 KB
-
 Youth dependency ratio, OWID.svg 850 × 600; 140 KB


,_OWID.svg)


_vs._level_of_prosperity,_OWID.svg)
,_OWID.svg)


,_OWID.svg)

),_OWID.svg)


),_OWID.svg)
),_OWID.svg)


),_OWID.svg)
,_OWID.svg)


.png)
.png)


.png)

_or_less_(green)_densely_populated_than_Earth%27s_average_population_density.,_OWID.svg)
,_OWID.svg)
_vs._Real_GDP_per_capita_(2011US$),_OWID.svg)


,_OWID.svg)


.png)


_(UN_(1950_to_2015)),_OWID.svg)
),_OWID.svg)
.svg)


,_OWID.svg)


),_OWID.svg)


),_OWID.svg)
,_OWID.svg)


),_OWID.svg)


),_OWID.svg)


.png)
.png)
.png)
.png)
.png)
.png)
.png)


),_OWID.svg)


,_OWID.svg)


),_OWID.svg)
_(Chinese_and_South_Korean_only),_OWID.svg)


,_OWID.svg)


,_OWID.svg)
),_OWID.svg)


,_OWID.svg)

),_OWID.svg)
),_OWID.svg)


,_OWID.svg)


