Category:Microarray analysis
Jump to navigation
Jump to search
Media in category "Microarray analysis"
The following 57 files are in this category, out of 57 total.
-
-
-
A-Molecular-Toolkit-to-Visualize-Native-Protein-Assemblies-in-the-Context-of-Human-Disease-srep14440-s3.ogv 2.5 s, 1,119 × 741; 201 KB
-
A-Molecular-Toolkit-to-Visualize-Native-Protein-Assemblies-in-the-Context-of-Human-Disease-srep14440-s4.ogv 2.5 s, 1,119 × 741; 185 KB
-
 Affymetrix-microarray.jpg 665 × 603; 130 KB
-
 Antibody microarray.jpg 2,001 × 774; 208 KB
-
Automated-measurement-of-cell-motility-and-proliferation-1471-2121-6-19-S1.ogv 38 s, 320 × 240; 2.43 MB
-
Automated-measurement-of-cell-motility-and-proliferation-1471-2121-6-19-S2.ogv 1 min 19 s, 320 × 240; 687 KB
-
Automated-measurement-of-cell-motility-and-proliferation-1471-2121-6-19-S3.ogv 1 min 51 s, 720 × 480; 1.23 MB
-
Automated-Whole-Animal-Bio-Imaging-Assay-for-Human-Cancer-Dissemination-pone.0031281.s004.ogv 1.4 s, 1,024 × 1,024; 200 KB
-
Automated-Whole-Animal-Bio-Imaging-Assay-for-Human-Cancer-Dissemination-pone.0031281.s005.ogv 8.8 s, 748 × 828; 941 KB
-
Automated-Whole-Animal-Bio-Imaging-Assay-for-Human-Cancer-Dissemination-pone.0031281.s006.ogv 2.2 s, 740 × 828; 1.16 MB
-
 Beta-catenin GeoProfile.png 473 × 448; 16 KB
-
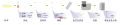
 C12orf60 Brain Expression Profile.pdf 2,018 × 214; 332 KB
-
-
-
-
 CSIRO ScienceImage 2744 test.jpg 1,221 × 1,768; 838 KB
-
De la saliva al código de ADN.ogv 1 min 23 s, 1,440 × 1,024; 44.74 MB
-
 Expression of C16orf71 in obese omental adipose tissue.png 455 × 375; 101 KB
-
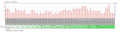 Expression profile of PRR29 in mice.png 2,372 × 650; 506 KB
-
Fra spytprøve til DNA-kode.ogv 1 min 23 s, 1,440 × 1,024; 44.74 MB
-
From spit to DNA-sample.webm 1 min 23 s, 1,440 × 1,024; 41.02 MB
-
Från saliv till DNA-kod.ogv 1 min 23 s, 1,440 × 1,024; 44.75 MB
-
Från saliv till DNA-kod.webm 1 min 23 s, 1,440 × 1,024; 41.01 MB
-
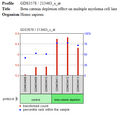
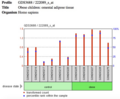
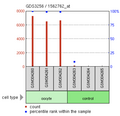
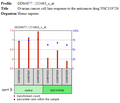 GEOProfile Ovarian Cancer Cell FAM149B1.png 521 × 449; 16 KB
-
 Human Protein Atlas SMIM19 RNA Expression Overview.png 2,504 × 912; 245 KB
-
 Journal.pone.0068902.g001.png 1,667 × 1,250; 787 KB
-
-
-
-
Large-scale-production-of-megakaryocytes-from-human-pluripotent-stem-cells-by-chemically-defined-ncomms11208-s5.ogv 35 s, 1,440 × 1,080; 1.29 MB
-
-
-
 Microarray and sequencing flow cell-ru.svg 739 × 400; 651 KB
-
 Microarray and sequencing flow cell.svg 739 × 400; 711 KB
-
 Microarray exp horizontal (zh-cn).svg 2,384 × 484; 445 KB
-
 Microarray exp horizontal gl.svg 2,384 × 484; 621 KB
-
 Microarray exp horizontal.svg 2,384 × 484; 527 KB
-
 Microarray or sequencing chip (green).svg 820 × 820; 327 KB
-
 Microarray slide.jpg 1,496 × 968; 951 KB
-
 MicroarryOocyte.png 646 × 624; 54 KB
-
 NA hybrid gl.svg 436 × 258; 318 KB
-
 NA hybrid.svg 436 × 258; 231 KB
-
 Observing microarray sample.jpg 1,993 × 3,000; 610 KB
-
 RAI14 Expression Within Human Brain.png 271 × 269; 62 KB
-
 Slide and genetic probes.jpg 690 × 487; 52 KB
-
 Summary of RNA Microarray-ru.svg 1,020 × 858; 69 KB
-
 Summary of RNA Microarray.svg 1,020 × 858; 67 KB
-
 Toxicology Research at FDA (NCTR 1179) (6008495329).jpg 3,822 × 2,538; 5.5 MB
-
 Transcriptomics technique publications over time-ru.svg 294 × 207; 170 KB
-
 Transcriptomics technique publications over time.svg 294 × 212; 133 KB
-
-
-
Transition-of-Plasmodium-Sporozoites-into-Liver-Stage-Like-Forms-Is-Regulated-by-the-RNA-Binding-ppat.1002046.s021.ogv 7.1 s, 2,124 × 1,288; 4.57 MB
-
从有唾液DNA读数.ogv 1 min 32 s, 1,440 × 1,024; 45.81 MB
-
从有唾液DNA读数.webm 1 min 23 s, 1,440 × 1,024; 32.41 MB


.svg)


_(6008495329).jpg)
.svg)