Category:Maps with Albers projection
Jump to navigation
Jump to search
English: This map-projection-related category exists in the following hierarchy:
- Category:Map projections
- Category:Maps by projection
- Category:Albers projection – media related to the Albers projection other than maps
- Category:Maps with Albers projection (“Category:Albers projections”) – maps made using the Albers projection
Media in category "Maps with Albers projection"
The following 149 files are in this category, out of 149 total.
-
 100 Mile Footraces in the Contiguous United States, 2011 A.svg 1,150 × 718; 1,018 KB
-
 100 Mile Footraces in the Contiguous United States, 2011.svg 1,153 × 721; 457 KB
-
 1809 Reichard Vereinigte Staaten von Nord-America.jpg 8,485 × 6,990; 21.76 MB
-
 Alaska area compared to conterminous US.svg 1,184 × 758; 221 KB
-
 Albers projection SW.jpg 2,058 × 1,208; 687 KB
-
 Albers with Tissot's Indicatrices of Distortion.svg 1,600 × 788; 595 KB
-
 Albers-equal-area-conic.png 673 × 346; 21 KB
-
 Austriarelief.jpg 2,500 × 1,281; 354 KB
-
 Austriawithoutcollar.jpg 2,130 × 1,100; 368 KB
-
 BR-Albers-Mercator.svg 512 × 512; 57 KB
-
 Canada Yukon location map-albers proj.svg 512 × 581; 444 KB
-
 Canada Yukon location map-albers proj2.svg 512 × 581; 444 KB
-
 Cascade Range blank map protected areas map-fr.svg 403 × 693; 3.21 MB
-
 Cascade Range major volcanoes topographic map-fr.png 403 × 693; 525 KB
-
 Cascade Range major volcanoes topographic map-fr.svg 403 × 693; 15.91 MB
-
 Cascade Range major volcanoes topographic map-it.svg 403 × 693; 5.46 MB
-
 Cascade Range map protected areas map-fr.svg 403 × 693; 3.63 MB
-
 Cascade Range map protected areas map-it.svg 403 × 693; 3.14 MB
-
 Cascade Range subdivisions map-es.svg 403 × 693; 2.99 MB
-
 Cascade Range subdivisions map-fr.svg 403 × 693; 3.07 MB
-
 Cascade Range subdivisions map-it.svg 403 × 693; 2.49 MB
-
 Cascade Range topographic blank map.png 403 × 693; 422 KB
-
 Cascade Range topographic map-fr.svg 403 × 693; 3.15 MB
-
 Cascade Range topographic map-it.svg 403 × 693; 2.5 MB
-
 City Lights of the United States 2012.jpg 6,646 × 4,430; 5.46 MB
-
 Columbia drainage basin blank map.png 808 × 790; 712 KB
-
 Columbia drainage basin map-fr.png 808 × 790; 897 KB
-
 Columbia major tributaries map-fr.svg 808 × 790; 3.89 MB
-
 Columbia tributaries drainage basin map-fr.svg 808 × 790; 3.89 MB
-
 Columbia tributaries drainage basin map-it.svg 808 × 790; 3.24 MB
-
Evolution of United States standard time zone boundaries.webm 29 s, 3,507 × 2,480; 4.58 MB
-
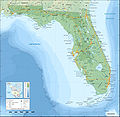 Florida topographic map-en.jpg 2,890 × 2,810; 1.76 MB
-
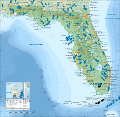
 Florida topographic map-en.svg 2,890 × 2,810; 2.51 MB
-
 Florida topographic map-fr.jpg 2,890 × 2,810; 1.75 MB
-
 Florida topographic map-fr.svg 2,890 × 2,810; 2.51 MB
-
 Florida topographic map-tr.svg 2,890 × 2,810; 2.5 MB
-
 Gauteng 2001 dominant population group map.svg 996 × 1,004; 897 KB
-
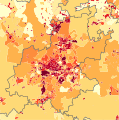 Gauteng 2001 population density map.svg 996 × 1,004; 1.33 MB
-
 Guatemala-geographic map-blank.svg 2,000 × 2,232; 14.42 MB
-
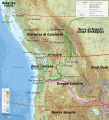
 Isthmus of Tehuantepec-aeac.jpg 800 × 456; 115 KB
-
 Isthmus of Tehuantepec-aeac.PNG 812 × 456; 764 KB
-
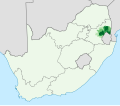
 KwaZulu-Natal 2001 dominant population group map.svg 938 × 1,066; 995 KB
-
 Maf-tiger road data 2010.png 10,000 × 6,000; 13.83 MB
-
 Missouri karst feature distribution v1.svg 820 × 734; 1.69 MB
-
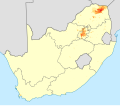
 North West 2001 population density map.svg 1,208 × 828; 1.76 MB
-
 Oklahoma topographic map-en.svg 3,952 × 2,000; 14.9 MB
-
 Oregon Country map-fr.svg 932 × 1,024; 4.57 MB
-
 Oregon Country map-it.svg 932 × 1,024; 2.56 MB
-
 Reis vak Albers Equal Area Kegelprojectie CM is115WL customized.PNG 739 × 636; 42 KB
-
 Snake River drainage basin map-fr.svg 808 × 790; 3.92 MB
-
 South Africa 2001 Afrikaans speakers proportion map.svg 1,072 × 933; 479 KB
-
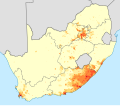
 South Africa 2001 Black African population density map.svg 1,072 × 933; 1.71 MB
-
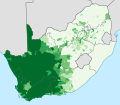
 South Africa 2001 Black African population proportion map.svg 1,072 × 933; 561 KB
-
 South Africa 2001 Coloured population proportion map.svg 1,072 × 933; 326 KB
-
 South Africa 2001 dominant language map.svg 1,072 × 933; 1,024 KB
-
 South Africa 2001 English speakers proportion map.svg 1,072 × 933; 237 KB
-
 South Africa 2001 Ndebele speakers density map.svg 1,072 × 933; 510 KB
-
 South Africa 2001 Ndebele speakers proportion map.svg 1,072 × 933; 157 KB
-
 South Africa 2001 Northern Sotho speakers density map.svg 1,072 × 933; 715 KB
-
 South Africa 2001 Northern Sotho speakers proportion map.svg 1,072 × 933; 228 KB
-
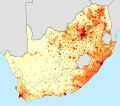
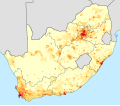
 South Africa 2001 population density map.svg 1,072 × 933; 1.89 MB
-
 South Africa 2001 sex ratio map.svg 1,072 × 933; 1.58 MB
-
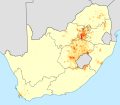
 South Africa 2001 Sotho speakers density map.svg 1,072 × 933; 974 KB
-
 South Africa 2001 Sotho speakers proportion map.svg 1,072 × 933; 263 KB
-
 South Africa 2001 Swati speakers density map.svg 1,072 × 933; 569 KB
-
 South Africa 2001 Swati speakers proportion map.svg 1,072 × 933; 167 KB
-
 South Africa 2001 Tsonga speakers density map.svg 1,072 × 933; 594 KB
-
 South Africa 2001 Tsonga speakers proportion map.svg 1,072 × 933; 191 KB
-
 South Africa 2001 Tswana speakers density map.svg 1,072 × 933; 744 KB
-
 South Africa 2001 Tswana speakers proportion map.svg 1,072 × 933; 263 KB
-
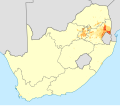
 South Africa 2001 Venda speakers density map.svg 1,072 × 933; 395 KB
-
 South Africa 2001 Venda speakers proportion map.svg 1,072 × 933; 163 KB
-
 South Africa 2001 White population proportion map.svg 1,072 × 933; 482 KB
-
 South Africa 2001 Xhosa speakers density map.svg 1,072 × 933; 1.12 MB
-
 South Africa 2001 Xhosa speakers proportion map.svg 1,072 × 933; 319 KB
-
 South Africa 2001 Zulu speakers density map.svg 1,072 × 933; 973 KB
-
 South Africa 2001 Zulu speakers proportion map.svg 1,072 × 933; 279 KB
-
 South Africa 2011 Afrikaans speakers density map.svg 809 × 709; 1.4 MB
-
 South Africa 2011 Afrikaans speakers proportion map.svg 809 × 709; 892 KB
-
 South Africa 2011 Black African population density map.svg 809 × 709; 1.83 MB
-
 South Africa 2011 Black African population proportion map.svg 809 × 709; 1.07 MB
-
 South Africa 2011 Coloured population density map.svg 809 × 709; 1.13 MB
-
 South Africa 2011 Coloured population proportion map.svg 809 × 709; 730 KB
-
 South Africa 2011 dominant language map (hex cells).svg 807 × 711; 922 KB
-
 South Africa 2011 dominant language map.svg 809 × 709; 798 KB
-
 South Africa 2011 English speakers density map.svg 809 × 709; 1.31 MB
-
 South Africa 2011 English speakers proportion map.svg 809 × 709; 431 KB
-
 South Africa 2011 Indian or Asian population density map.svg 809 × 709; 803 KB
-
 South Africa 2011 Indian or Asian population proportion map.svg 809 × 709; 341 KB
-
 South Africa 2011 Ndebele speakers density map.svg 809 × 709; 905 KB
-
 South Africa 2011 Ndebele speakers proportion map.svg 809 × 709; 337 KB
-
 South Africa 2011 Nguni speakers density map.svg 809 × 709; 1.63 MB
-
 South Africa 2011 Nguni speakers proportion map.svg 809 × 709; 811 KB
-
 South Africa 2011 Northern Sotho speakers density map.svg 809 × 709; 870 KB
-
 South Africa 2011 Northern Sotho speakers proportion map.svg 809 × 709; 438 KB
-
 South Africa 2011 population density map (hex cells).svg 807 × 711; 1.41 MB
-
 South Africa 2011 population density map.svg 809 × 709; 1.93 MB
-
 South Africa 2011 Sotho speakers density map.svg 809 × 709; 1.1 MB
-
 South Africa 2011 Sotho speakers proportion map.svg 809 × 709; 501 KB
-
 South Africa 2011 Sotho-Tswana speakers density map.svg 809 × 709; 1.44 MB
-
 South Africa 2011 Sotho-Tswana speakers proportion map.svg 809 × 709; 816 KB
-
 South Africa 2011 Swazi speakers density map.svg 809 × 709; 679 KB
-
 South Africa 2011 Swazi speakers proportion map.svg 809 × 709; 347 KB
-
 South Africa 2011 Tsonga speakers density map.svg 809 × 709; 821 KB
-
 South Africa 2011 Tsonga speakers proportion map.svg 809 × 709; 388 KB
-
 South Africa 2011 Tswana speakers density map.svg 809 × 709; 1.01 MB
-
 South Africa 2011 Tswana speakers proportion map.svg 809 × 709; 543 KB
-
 South Africa 2011 Venda speakers density map.svg 809 × 709; 647 KB
-
 South Africa 2011 Venda speakers proportion map.svg 809 × 709; 347 KB
-
 South Africa 2011 West Germanic speakers density map.svg 809 × 709; 1.73 MB
-
 South Africa 2011 West Germanic speakers proportion map.svg 809 × 709; 1.03 MB
-
 South Africa 2011 White population density map.svg 809 × 709; 1.19 MB
-
 South Africa 2011 White population proportion map.svg 809 × 709; 720 KB
-
 South Africa 2011 Xhosa speakers density map.svg 809 × 709; 1.25 MB
-
 South Africa 2011 Xhosa speakers proportion map.svg 809 × 709; 571 KB
-
 South Africa 2011 Zulu speakers density map.svg 809 × 709; 1.18 MB
-
 South Africa 2011 Zulu speakers proportion map.svg 809 × 709; 534 KB
-
 South Africa Census 2001 main places blank.svg 1,072 × 933; 2.72 MB
-
 South Washington Cascade Range topographic map-fr.svg 720 × 722; 6.86 MB
-
 South Washington protected areas map-fr.svg 720 × 722; 6.86 MB
-
 Spain 411 es.svg 1,263 × 1,053; 480 KB
-
 Spain 411 pt.svg 1,263 × 1,053; 479 KB
-
 Spain 411 ru.svg 1,263 × 1,053; 1.03 MB
-
 Spain 430—455 es.svg 1,262 × 1,053; 962 KB
-
 Spain 430—455 ru.svg 1,262 × 1,053; 1.07 MB
-
 Trails of Cascade Range map-fr.svg 403 × 693; 3.3 MB
-
 Trails of Cascade Range map-it.svg 403 × 693; 2.65 MB
-
 United States at night.jpg 6,646 × 4,430; 7.46 MB
-
 United States by Gini Coefficient.png 935 × 722; 193 KB
-
 USDA Hardiness zone map.jpg 4,014 × 4,002; 5.92 MB
-
 Visigothic Kingdom 586-711 es.svg 1,246 × 975; 1.09 MB
-
 Visigothic Kingdom 586-711 pt.svg 1,246 × 975; 401 KB
-
 Visigothic Kingdom 586-711 ru.svg 1,263 × 1,053; 1.39 MB
-
 Vs albers equal area kegel-projectie.PNG 732 × 602; 52 KB
-
 Vs albers equal area kegel-projectie2.PNG 683 × 649; 119 KB
-
 Washington administrative blank map.png 1,031 × 675; 742 KB
-
 Washington administrative map-fr.svg 1,031 × 675; 4.06 MB
-
 Washington areas Columbia map-fr.svg 1,031 × 675; 7.04 MB
-
 Washington areas map-fr.svg 1,031 × 675; 7.06 MB
-
 Washington municipal corporation topographic map-fr.svg 596 × 389; 7.43 MB
-
 Washington topographic blank map-2.png 1,031 × 675; 910 KB
-
 Washington topographic blank map.png 1,031 × 675; 1,002 KB
-
 Washington topographic map-fr.png 1,031 × 675; 1.01 MB
-
 Washington topographic map-fr.svg 1,031 × 675; 6.52 MB
-
 Washington tribal territories map-fr.svg 1,031 × 675; 6.3 MB
-
 World borders albers 0 33.png 2,595 × 1,356; 630 KB
-
 World borders albers.png 2,222 × 1,665; 635 KB
-
 World-albers.png 800 × 383; 23 KB
-
 Проекция Альберса (GMT).gif 1,000 × 600; 43 KB


.svg)


.svg)


.gif)