Category:Information graphics about economy
Jump to navigation
Jump to search
Subcategories
This category has the following 21 subcategories, out of 21 total.
A
B
- Budget charts (81 F)
C
D
E
F
- FRED charts, graphs, maps (156 F)
G
H
- Hype cycle (16 F)
I
L
M
P
- Economic pie charts (106 F)
S
Media in category "Information graphics about economy"
The following 155 files are in this category, out of 155 total.
-
 10 Largest Corporations by Market Capitalization.png 1,500 × 1,125; 281 KB
-
 1985-2014年中央政府、地方政府财政收入占全国财政收入比重简体版.jpeg 934 × 546; 120 KB
-
 1985-2014年中央政府、地方政府财政收入占全国财政收入比重繁体版.jpeg 934 × 546; 124 KB
-
 ACS.png 1,366 × 768; 585 KB
-
 ACS2.png 719 × 348; 46 KB
-
 Africa Economia.jpg 1,888 × 2,316; 1.22 MB
-
 Armenian forein debt dynamics chart.png 880 × 332; 858 KB
-
 AttentionEconomy concept.png 592 × 336; 14 KB
-
 Bank-Hierarchie-Clearing.png 1,478 × 850; 124 KB
-
 Bank-Hierarchie-Ueberweisung.png 1,472 × 870; 129 KB
-
 Bank-Hierarchie.png 2,000 × 1,064; 211 KB
-
 Bell telephone magazine (1922) (14569939137).jpg 1,232 × 894; 156 KB
-
 Billing schemes.jpg 800 × 1,136; 89 KB
-
 BKT vaesto Eurooppa.PNG 1,228 × 700; 79 KB
-
 Celkove naklady.png 347 × 319; 8 KB
-
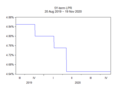
 China 1Y-term LPR from 20 Aug 2019 to 19 Nov 2020.png 576 × 432; 7 KB
-
 China 1Y-term LPR from 25 Oct 2013 to 16 Aug 2019.png 576 × 432; 9 KB
-
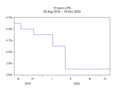
 China 5Y-term LPR from 20 Aug 2019 to 19 Nov 2020.png 585 × 432; 7 KB
-
 Climate change cumulative emissions 2003.png 1,691 × 581; 75 KB
-
 Climate change emissions per capita.png 1,623 × 561; 62 KB
-
 Climate change gdp per capita.png 1,656 × 559; 62 KB
-
 Climate change historic and predicted 2003.png 1,354 × 902; 98 KB
-
 Co-generated data.png 977 × 593; 93 KB
-
 Consumer constraint choice income shift lo.png 357 × 250; 8 KB
-
 Consumer constraint choice income shift.svg 405 × 279; 5 KB
-
 Contributions to the UK economy in 2011 by region.png 576 × 960; 234 KB
-
 Cyprus GDP.svg 512 × 427; 37 KB
-
 Das Gütermarktgleichgewicht.jpg 1,079 × 1,011; 266 KB
-
 Diseconomics of scale.svg 500 × 300; 12 KB
-
 ECB and Federal Reserve main policy rates from January 2022.png 703 × 342; 11 KB
-
 Ecociclo 2.gif 340 × 226; 4 KB
-
 Economia-America-Latina.png 599 × 401; 16 KB
-
 Economic cycles- their law and cause (1914) (20529482633).jpg 1,504 × 2,122; 305 KB
-
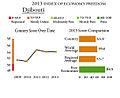 Economic Freedom.jpg 605 × 493; 111 KB
-
 Economic health 2011-2012.png 1,160 × 923; 98 KB
-
 Economic health 2012.png 1,147 × 923; 115 KB
-
 Einkommen-glück.png 1,493 × 893; 53 KB
-
 Ekonominin Gelişme Aşamaları ve Orta Gelir Tuzağı.jpg 754 × 349; 18 KB
-
 Embrayage méta-attentionnel.png 1,246 × 711; 31 KB
-
 Emerging Markets except China and India.JPG 830 × 768; 94 KB
-

-
 Erwerbslosigkeit (50719293482).png 851 × 700; 110 KB
-
 Evolución del PIB de España desde el 2000.png 4,096 × 3,146; 283 KB
-
 Evolución del PIB nominal de Granada.png 4,096 × 4,096; 275 KB
-
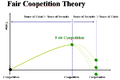 Faircoopetition.png 756 × 505; 30 KB
-
 Fallas de mercado.jpg 1,293 × 761; 141 KB
-
 Fishing-methods.png 1,746 × 2,590; 950 KB
-
 Fomcprojtabl20170315.png 7,568 × 5,328; 159 KB
-
 GDP and Population of European Countries 2010.png 1,236 × 698; 45 KB
-
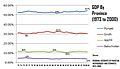 GDP by Province.jpg 1,916 × 1,108; 145 KB
-
 GDP identity from the income side.png 911 × 661; 40 KB
-
 GDP vs GPI in US.jpg 225 × 260; 18 KB
-
 Geothermal-energy-production-pl.svg 800 × 500; 41 KB
-
 Gesamte BWS Länder2.svg 800 × 500; 262 KB
-
 Gewinnmaximierung grafisch mit Grenzkosten und Grenzerlös.svg 920 × 644; 47 KB
-
 Gewinnmaximierung grafisch.svg 1,295 × 1,091; 84 KB
-
 Graf ekonomicka renta((Created with Microsoft Paint)).png 1,133 × 501; 23 KB
-
 Graphic charts of companies and capitals in Taiwan 1937.jpg 864 × 1,269; 147 KB
-
 Großhandel-Ökosystem .jpg 4,081 × 2,425; 776 KB
-
-
 Grupos socioeconómicos en Santo Domingo según circunscripciones, 2002.png 1,056 × 608; 51 KB
-
 Gráfico 2.1 Evolución PIB per Cápita.png 1,287 × 624; 33 KB
-
 Gráfico 2.2 Crecimiento PIB per cápita.JPG 799 × 368; 38 KB
-
 Gráfico 2.2.jpg 824 × 399; 50 KB
-
 Gráfico 2.3 Convergencia y Divergencia.JPG 860 × 457; 88 KB
-

-

-
-
 Iceberg-elaborated.png 2,481 × 3,508; 576 KB
-
 Indicadores.gif 656 × 918; 26 KB
-
 Inflacja.png 1,156 × 1,134; 21 KB
-
 Inflation2.png 1,169 × 1,135; 26 KB
-
 Informe-de-resultados-mifacturacion.jpg 1,660 × 1,079; 268 KB
-
 J-curve-may2-2020.png 213 × 321; 10 KB
-
 K-shaped recovery.png 960 × 540; 218 KB
-
 Kesetaraan Gender dalam Kehidupan Ekonomi Perempuan.png 880 × 2,000; 282 KB
-
 Lebanon is a refuge more than a magnet Rosalie Berthier.jpg 1,000 × 999; 101 KB
-
-
 Lihtprogressioon.jpg 960 × 720; 50 KB
-
 Localnonsatiation.svg 540 × 360; 9 KB
-
 Malthusian economy.jpg 348 × 635; 29 KB
-
 Money supply of japan.gif 671 × 380; 17 KB
-
 Monopsony-minimum-wage.svg 217 × 217; 10 KB
-
 Naa newspaper ad revenue.svg 511 × 335; 71 KB
-
 Najwieksze gospodarki pod wzgledem nominalnego PKB w stosunku do swiata.svg 1,600 × 815; 200 KB
-
 National net worth per capita top100 PPP 2000.gif 380 × 1,232; 31 KB
-
 Near future of electric vehicles same.jpg 1,448 × 1,254; 144 KB
-
 Nennwertkonvergenz flache Zinskurve.png 256 × 256; 7 KB
-
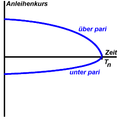
 Nennwertkonvergenz steigende Zinskurve ueber pari.png 256 × 256; 4 KB
-
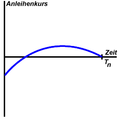 Nennwertkonvergenz steigende Zinskurve unter pari.png 256 × 256; 4 KB
-
 NettALGII.png 1,118 × 577; 72 KB
-
 Neutralita v DPH.png 983 × 419; 25 KB
-
 Newest one growth rate.png 643 × 404; 123 KB
-
 Paymaster.png 552 × 252; 12 KB
-
 PPP GDP 1800-2017.png 1,922 × 1,415; 381 KB
-
 Produttività.png 572 × 322; 218 KB
-
 Quits rate.jpg 1,460 × 797; 214 KB
-
 Raaka-aineiden kulutus ja talouden kehitys Suomessa.png 771 × 456; 36 KB
-
-
 Regional GDP of west papua.jpg 851 × 344; 52 KB
-

-
 Scoreboard.pdf 1,275 × 1,787; 72 KB
-
 Selected towns in Germany, according to the New Creative Index.PNG 610 × 643; 23 KB
-
 Selic.jpg 1,597 × 560; 261 KB
-
 Sistema economico.jpg 819 × 460; 67 KB
-

-
 Spending.JPG 440 × 246; 19 KB
-
 Supplycurve.gif 290 × 229; 3 KB
-
 Taylor-Zins und Euro Währungssystem.png 690 × 458; 19 KB
-
 Taylor-Zins und Tagesgeldsatz.png 695 × 456; 26 KB
-

-
 The Lebanese Pozi scheme - the companies involved Rosalie Berthier.jpg 1,000 × 999; 66 KB
-
 The Syrian war's windfall Rosalie Berthier.jpg 1,000 × 999; 85 KB
-
-
 Think about justice (landscape).jpg 809 × 637; 115 KB
-
 Think about the future (landscape).jpg 850 × 673; 154 KB
-
 Top 5 United States Ports Moving Agricultural Exports (11717848963).jpg 1,494 × 973; 158 KB
-
 Trade-Cuba.png 10,357 × 6,473; 1.01 MB
-
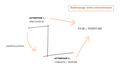
 Transaction immo avril 2011.svg 512 × 410; 74 KB
-
 Trendkanaal.GIF 1,152 × 731; 22 KB
-
 Un millénaire de croissance mondiale.png 600 × 371; 11 KB
-
 UNECE countries in figures 2007 France.jpg 1,475 × 2,488; 377 KB
-
 Unemployment.PNG 672 × 711; 34 KB
-
 US average hourly earnings growth.png 990 × 459; 48 KB
-
 US growth rate of labor productivity.png 968 × 550; 82 KB
-
 US Inflation rate.png 918 × 452; 18 KB
-
 US Labor Participation Rate 1948-2011.svg 720 × 540; 45 KB
-
 US Labor Participation Rate.gif 600 × 300; 6 KB
-
 US Real compensation growth.jpg 960 × 720; 42 KB
-
 US Soy Exports Infographic (11717396995).jpg 1,800 × 1,200; 715 KB
-
 US Soy Transportation Costs (13702071264).jpg 1,815 × 2,352; 1.05 MB
-
 US Soybean Exports Infographic (11731979063).jpg 2,550 × 3,300; 1.16 MB
-
 US work week - GDP - GPI.jpg 449 × 262; 25 KB
-
 USprofitsVsCPIchange.png 968 × 450; 57 KB
-
 Utveckling USAs statsskuld 1940 2010.jpg 723 × 572; 50 KB
-
 Valda statsskulder 2011.jpg 509 × 373; 38 KB
-
 Value curve airlines 02.gif 891 × 671; 13 KB
-
 Vegetable Oil is Soybean Oil (19349485773).jpg 1,101 × 799; 140 KB
-
 What did Malaysia export in 2016?.jpg 1,220 × 705; 141 KB
-
 World GDP Per Capita 1500 to 2000, Log Scale.png 606 × 441; 20 KB
-
 World oil consumption 1980 to 2007 by region.svg 600 × 450; 101 KB
-
 World oil consumption 91980 to 2007 by region-ar.png 1,280 × 960; 121 KB
-
 Évolution du PIB de la Grèce entre 1960 et 1985.png 744 × 409; 31 KB
-
 Παράδειγμα αυξήσεις μειώσεις σταθεροποίηση τιμών.jpg 1,677 × 883; 186 KB
-
 Величина госдолга стран ЕС и его отношение к ВВП.png 960 × 720; 54 KB
-
 Голодомор 1932-1933 гг. на Украине.jpg 593 × 698; 189 KB
-
 Миграционная модель Тодаро.png 703 × 627; 18 KB
-
 Модель поиска работы с «фиксированной выборкой».png 685 × 777; 12 KB
-
 Модель поиска работы с резервной заработной платой.png 541 × 673; 14 KB
-
 Определение резервной заработной платы.png 709 × 692; 14 KB
-
 Распределение предлагаемой заработной платы.png 637 × 626; 19 KB
-
 Соотношение оптимального и равновесного темпов роста.jpg 617 × 568; 47 KB
-
 Фазовая диаграмма модели Мэнкью-Ромера-Вейла.jpg 453 × 350; 25 KB
-
 Հնա.svg 576 × 432; 23 KB
-
 科摩羅對中國的出口.PNG 1,518 × 695; 93 KB


_(14569939137).jpg)


_(20529482633).jpg)


.png)


).png)


_1980-2011.jpg)
.jpg)


_2020.svg)


.jpg)
.jpg)
.jpg)


.jpg)
.jpg)


.jpg)


.jpg)