Category:Genetic studies on Tibetans
Jump to navigation
Jump to search
English: Genetic studies on Tibetans, people living in Tibet in Central Asia and East Asia, speaking Tibetic languages.
Subcategories
This category has the following 2 subcategories, out of 2 total.
E
- EPAS1 (8 F)
S
- Genetic studies on Sherpas (9 F)
Media in category "Genetic studies on Tibetans"
The following 33 files are in this category, out of 33 total.
-

-

-
 Admixture analysis of East Asian populations.png 1,195 × 888; 211 KB
-
 Admixture analysis of Nepalese and Sherpa.png 1,828 × 880; 261 KB
-

-

-
 Ethnolinguistic map of China 1983.jpg 1,024 × 960; 122 KB
-

-
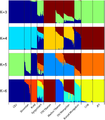
 Genetic relationships between population pairs of Tibetan and others - frappe.png 4,687 × 1,238; 345 KB
-
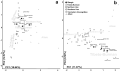
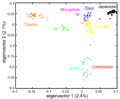 Genetic relationships between population pairs of Tibetan and others - PCA.png 3,238 × 2,665; 394 KB
-
 Genetic relationships between population pairs of Tibetan and others.png 3,439 × 4,597; 711 KB
-
 Genome-wide admixture of Eurasian individuals inferred by ADMIXTURE.png 1,906 × 2,171; 100 KB
-
 Geographic distribution of Y chromosome haplogroup D1.png 2,527 × 1,788; 1.09 MB
-
 Geographic distribution of Y chromosome haplogroup D3a.png 2,496 × 1,778; 1.12 MB
-
 Geographic distributions of Y chromosome haplogroups D-M174 in East Asia.png 1,434 × 1,351; 984 KB
-
 Locations and genetic makeup of the Malays and other populations.jpg 926 × 677; 120 KB
-
 MtDNA haplogroup distribution of Tibetans with different geographic locations.jpg 2,000 × 1,556; 261 KB
-
 Neighbor-joining tree of Northern Eurasian populations.png 1,917 × 2,371; 136 KB
-
 PCA of Nepalese and neighbouring populations.png 1,100 × 913; 419 KB
-
 PCA of ten northern Eurasian populations and six East Asian populations.png 1,956 × 3,186; 496 KB
-

-
 PCA study of East Asian populations.png 665 × 909; 251 KB
-
 Phylogenetic tree and PCA of East Asian populations.png 553 × 828; 127 KB
-
 Plots of pairwise Fst of Tibetan in Gannan, Tianzhu and other 59 worldwide populations.png 2,258 × 2,002; 1.44 MB
-
 Principal component analysis among Asian populations.jpg 1,280 × 1,217; 72 KB
-
 Procrustes-transformed PCA plot of genetic variation of Asian populations.png 2,069 × 1,390; 404 KB
-
-
 Run of homozygosity in Himalayan populations.png 676 × 515; 6 KB
-
 Run of homozygosity in Sherpa and Nepalese populations.png 1,529 × 894; 213 KB
-
 Spatial frequency distributions of haplogroup M9a'b.png 587 × 383; 221 KB
-
 The Y-STR network of four minor haplogroups in Sherpas.png 729 × 736; 196 KB
-
 Tibet claims.svg 1,070 × 695; 975 KB
-
 Y chromosome and mtDNA haplogroup frequencies of studied Qiangic populations.png 4,981 × 2,394; 8.52 MB


.png)