Category:Energy statistics of Germany
Jump to navigation
Jump to search
Countries of Europe: Austria · Belgium · Denmark · Estonia · France‡ · Germany · Iceland · Italy · Portugal‡ · Russia‡ · Spain‡ · Switzerland · United Kingdom
‡: partly located in Europe
‡: partly located in Europe
Main category: Energy statistics
Subcategories
This category has the following 4 subcategories, out of 4 total.
E
- Electricity prices in Germany (32 F)
R
Media in category "Energy statistics of Germany"
The following 110 files are in this category, out of 110 total.
-
 1998-2005 German-production-of-coal-mine-methane.jpg 802 × 399; 122 KB
-
 1998-2005 Grubengasnutzung-in-Deutschland.jpg 806 × 396; 121 KB
-
 2018-03-REandNuclearPhaseout-1024x717.png 1,024 × 717; 390 KB
-
 Bruttostromerzeugung Deutschland.svg 640 × 480; 26 KB
-
 Bruttostromerzeugung.jpg 600 × 450; 130 KB
-
 Bruttostromverbrauch.png 1,584 × 1,224; 35 KB
-
 Bundesarchiv Bild 183-16116-0001, Nachtdrusch..jpg 575 × 800; 57 KB
-
 CO2 Deutschland.jpg 653 × 404; 168 KB
-
 Coal Balance Germany.svg 990 × 540; 65 KB
-
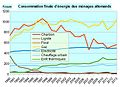 Conso finale énergie ménages allemands.jpg 442 × 321; 28 KB
-
 Conso éner finale Allemagne cumul.jpg 442 × 321; 25 KB
-
 Conso éner finale Allemagne.jpg 442 × 306; 24 KB
-
 Conso éner finale par agent Allemagne cumul.jpg 442 × 302; 28 KB
-
 Conso éner finale par agent Allemagne.jpg 442 × 295; 30 KB
-
 Conso éner prim Allemagne.jpg 442 × 302; 27 KB
-
 Conso énergie primaire Allemagne 2012.jpg 491 × 284; 20 KB
-
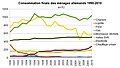 Consommation finale ménages allemands 1990-2010.jpg 567 × 321; 30 KB
-
 EEG Umlagemechanismus.png 970 × 601; 34 KB
-
 EEG-Entwicklung.svg 446 × 269; 16 KB
-
 EEG-Umlage-2016.jpeg 800 × 600; 51 KB
-
 EES EAEC. Энергетическая зависимость Германии, 1990-2018 гг., %.svg 600 × 371; 190 KB
-
 EESEAEC. Энергетическая зависимость Германии, 1990-2019 гг., %.svg 600 × 371; 193 KB
-
 Einfuhrpreise von Primärenergie in Deutschland.svg 1,350 × 631; 29 KB
-
 Electricity-price-germany-components.png 1,200 × 886; 598 KB
-
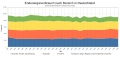 Endenergieverbrauch nach Bereich in Deutschland.svg 1,350 × 631; 28 KB
-
 Energie finale cons 1990-2011.jpg 567 × 348; 28 KB
-
 Energie finale cons sect 1990-2011.jpg 567 × 340; 25 KB
-
 Energie primaire 1990-2011.jpg 529 × 302; 21 KB
-
 Energie primaire consommée par agent 1990-2011.jpg 529 × 340; 27 KB
-
 Energieerzeugung in Deutschland 2004.png 2,000 × 1,558; 200 KB
-
 Energieerzeugung in Deutschland 2004.svg 700 × 500; 2 KB
-
 Energiemix DE 2010.png 695 × 622; 21 KB
-
 Energiemix Deutschland 2007.gif 851 × 655; 10 KB
-
 Energiemix Deutschland 2011.png 1,001 × 569; 67 KB
-
 Energietraeger Deutschland Zeitreihe.png 1,584 × 1,224; 63 KB
-
 Energieträger Deutschland.gif 483 × 291; 32 KB
-
 Energieverbrauch DE 2017.png 1,144 × 511; 68 KB
-
 Energieverbrauch Deutschland nach Bereichen in Prozent.png 886 × 504; 13 KB
-
 Energieverbrauch Deutschland nach Bereichen.gif 886 × 503; 17 KB
-
 Energieverbrauch Deutschland.svg 750 × 420; 12 KB
-
 Energieverbrauch.gif 408 × 416; 14 KB
-
 EnR 1990-2010.jpg 442 × 284; 26 KB
-
 Fact explic conso éner résid Allemagne.jpg 518 × 367; 40 KB
-
 Fact explic conso éner transp Allemagne.jpg 480 × 348; 29 KB
-
 Facteurs explicatifs ménages 1990-2010.jpg 597 × 344; 30 KB
-
 Facteurs explicatifs transports 1990-2010.jpg 567 × 321; 27 KB
-
 Forschungsausgaben bund deutschland zeitreihe 74bis08.jpg 1,660 × 1,173; 166 KB
-
 Fossil fuel consumption in Germany.svg 461 × 319; 80 KB
-
 Gas Balance Germany.svg 990 × 540; 74 KB
-
 Germany electricity generation pie chart 2015.svg 800 × 600; 16 KB
-
 Germany electricity generation pie chart May 2016.svg 800 × 600; 19 KB
-
 Germany electricity mix 1st half 2014.png 317 × 540; 24 KB
-

-
 Germany-energy-mix.png 600 × 450; 166 KB
-
 GET 1A4 Renewables create more jobs l.png 1,000 × 768; 24 KB
-
 GET 2A13 the future grid l.png 1,000 × 768; 87 KB
-
 GET 2A6 growing renewables in germany l.png 1,000 × 768; 57 KB
-
 GET 3A7 housing sector energy savings l.png 1,000 × 768; 31 KB
-
 GET 6A3 renewables are the reason for surcharge l.png 1,000 × 768; 52 KB
-
 GET en 1A1 growing economy declining emissions-e1435069269260.png 1,000 × 768; 523 KB
-
 GET en 2A16 cooperatives drive energy transition.png 1,001 × 769; 53 KB
-
 GET en 2A5 feed-in tariffs grow.png 1,001 × 769; 67 KB
-
 GET en 2A8 wind turbines 2A8 wind turbines l 2A8 wind turbines.png 2,083 × 1,600; 194 KB
-
 GET en 3A2 shutting down nuclear plants.png 1,001 × 769; 56 KB
-
 GET en 3A8 grid liability and renewables l.png 1,001 × 769; 63 KB
-
 Gross-power-production-germany-1990-2022.png 1,200 × 848; 212 KB
-
 Haushalt-Energieverbrauch.svg 500 × 400; 82 KB
-
 Importanteil Energieträger Deutschland 2013.png 1,001 × 769; 65 KB
-
 Kohle1817ff.PNG 970 × 603; 15 KB
-
 LCOE stromgestehungskosten vergleich fraunhofer november 2013.svg 2,085 × 1,468; 31 KB
-
 Merit Order 2008 edited by Source crtitic necessary -edited in PPT.png 1,083 × 655; 64 KB
-
 Merit Order 2008.PNG 832 × 525; 24 KB
-
 Merit-Order-Beispielrechnung für WP.png 962 × 500; 94 KB
-
 NEP 2013 Erzeugung.png 970 × 604; 24 KB
-
 NEP 2013 Kapazität.png 970 × 604; 24 KB
-
 Neu Energieforschung1977bis2017.png 881 × 620; 47 KB
-
 Oeffentliche Nettostromerzeugung Deutschland 2021.svg 425 × 390; 26 KB
-
 Power-plant-acceptance-germany-1.png 800 × 820; 32 KB
-
 Power-plant-acceptance-germany.jpg 800 × 820; 281 KB
-
 Power-plant-acceptance.jpg 600 × 450; 172 KB
-
 Preisindex Endenergie Deutschland 2012.png 970 × 601; 25 KB
-
 Preisindex Primärenergie Deutschland 2012.png 970 × 601; 25 KB
-
 Primaarenergia tarbimine Saksamaal.jpg 586 × 383; 110 KB
-
 Primärenenergieverbrauch Deutschland.svg 1,054 × 362; 48 KB
-
 Primärenenergieverbrauch Deutschland2.svg 1,135 × 403; 34 KB
-
 Primärenergie Importabhängigkeit.png 986 × 603; 21 KB
-
 Primärenergieverbrauch nach Energieträgern in Deutschland.svg 1,120 × 631; 49 KB
-
 Primärenergieverbrauch.png 1,890 × 1,004; 119 KB
-
 Pro-Kopf-Verbrauch 2013 D Fossile Energie.png 876 × 486; 101 KB
-
 Prod brute élec Allemagne.jpg 442 × 302; 27 KB
-
 Prod éner prim Allemagne.jpg 442 × 295; 25 KB
-
 Production allemande totale EnR.jpg 442 × 302; 28 KB
-
 SAIDI-Deutschland-2006-2011.png 721 × 390; 17 KB
-
 Share-energy-sources-gross-german-power-production-2022.png 1,200 × 848; 212 KB
-
 Stromerzeugung 2016.jpg 1,600 × 1,200; 489 KB
-
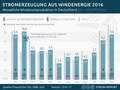 Stromerzeugung aus Windenergie in Deutschland 2015.png 800 × 600; 101 KB
-
 Stromerzeugung Deutschland.png 800 × 600; 30 KB
-
 Stromerzeugung-fossile.jpg 600 × 450; 116 KB
-
 Stromgestehungskosten Deutschland 2018 laut Fraunhofer ISE.png 614 × 422; 9 KB
-
 Stromgestehungskosten Deutschland 2018.png 614 × 422; 6 KB
-
 Stromgestehungskosten Fraunhofer 2021.svg 650 × 400; 26 KB
-
 Stromgestehungskosten VGBPowerTech15+Fraunhofer21.svg 650 × 420; 21 KB
-
 Strommix-D-2009.png 803 × 646; 84 KB
-
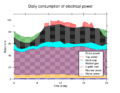 Tagesgang engl.png 792 × 612; 13 KB
-
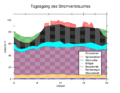 Tagesgang.png 792 × 612; 12 KB
-
 Tagesverlauf des Stromverbrauchs.svg 1,104 × 672; 151 KB
-
 Verbrauch Endenergie private Haushalte.png 583 × 564; 12 KB
-
 Verbraucherpreise Energie.svg 640 × 400; 39 KB
-
 Verbraucherpreise von Endenergie in Deutschland.svg 1,350 × 631; 48 KB
-
 Éner finale cons par secteur Allemagne.jpg 442 × 310; 24 KB


.png)


