Category:Energy diagrams
Jump to navigation
Jump to search
Subcategories
This category has the following 19 subcategories, out of 19 total.
B
D
- Energy and society diagrams (3 F)
F
H
- Heat exchanger diagrams (1 P, 132 F)
I
L
N
- Natural gas diagrams (43 F)
P
R
S
T
Media in category "Energy diagrams"
The following 182 files are in this category, out of 182 total.
-
 Aktivierungsenergie Verbrennung von Zucker.svg 935 × 537; 94 KB
-
 Aktivierungsenergie-Lagerfeuer.svg 512 × 255; 228 KB
-
 Algerije Energie 1965-2010.png 1,800 × 1,200; 19 KB
-
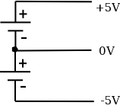 Alim-symetrique.png 158 × 147; 2 KB
-
 ARCHIMEDES WAS WRONG.jpg 1,520 × 982; 701 KB
-
 Atom in box.JPG 556 × 352; 23 KB
-
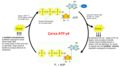 ATP cycle ku.png 1,885 × 1,058; 262 KB
-
 ATP cycle.png 6,473 × 4,499; 620 KB
-
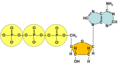 ATP molecule.png 2,590 × 1,419; 89 KB
-
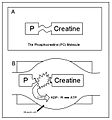 ATP-PC.jpg 646 × 691; 41 KB
-
 ATPsyn.gif 300 × 256; 88 KB
-
 Bacteriorhodopsin chemiosmosis.gif 880 × 1,190; 77 KB
-
 Balancing Supply and Demand in the Grid.jpg 1,230 × 931; 92 KB
-
 Belier demolition bacpro batEOGT 2006.svg 166 × 199; 9 KB
-
 Belsohom.png 512 × 288; 4 KB
-
 BenjaminTignerFig5US8066225.JPG 511 × 334; 44 KB
-
 Big Oil 2022.jpg 2,250 × 4,000; 650 KB
-
 Big oil.jpg 580 × 530; 229 KB
-
 Big Oil.svg 750 × 720; 466 KB
-
 Bilan énergétique France 2020 d'après SDES et blocs.png 2,000 × 1,539; 314 KB
-
 Bilan énergétique France 2020 french energy balance From SDES open data.png 1,850 × 1,539; 288 KB
-
 Biogasanlage Schema Trockenvergärung.png 3,579 × 2,551; 3.65 MB
-
 Blockfließbild EBSEnergiezentrale.jpg 1,024 × 731; 83 KB
-
 Bond Energy Diagrams.png 861 × 246; 100 KB
-
 Butane conformations and relative energies.svg 1,013 × 413; 48 KB
-
 Carbon flow new.jpg 400 × 200; 11 KB
-
 Carbon flow.jpg 1,200 × 600; 46 KB
-
 Cathode materials.jpg 575 × 204; 15 KB
-
 Cellular respiration.gif 880 × 887; 80 KB
-
 Chart it77.png 558 × 333; 11 KB
-
 Chart MPG to L-100km v2009-10-08.svg 1,313 × 910; 223 KB
-
 Chart MPG to Litre-100km.svg 778 × 470; 36 KB
-
 Chemins de l'énergie.png 1,085 × 658; 151 KB
-
 Chemiosmotic coupling mitochondrion.gif 400 × 259; 17 KB
-
 Chemiosmotic proton transfer.gif 800 × 660; 56 KB
-
 Chemiosmotic proton transfer.tr.png 727 × 600; 52 KB
-
 CicloCombinadoVSdemanda.png 877 × 571; 20 KB
-
 CicloCombinadoVSdemandaSpain.png 876 × 572; 19 KB
-
 Clasificacion8.jpg 559 × 546; 74 KB
-
 Co2 ja ydinvoima.png 754 × 721; 4 KB
-
 Combustibili fossili.png 1,123 × 794; 2.55 MB
-
 Combustibili fossili.svg 512 × 362; 1.18 MB
-
 Consumption sector treemap.png 1,800 × 1,500; 329 KB
-
 Cycle Energie.svg 651 × 720; 182 KB
-
 Cyclohexane conformations and energies with hydrogens.svg 512 × 291; 18 KB
-
 Cyclohexane ring flip and relative conformation energies.svg 849 × 483; 17 KB
-
 Deaerator.png 296 × 299; 7 KB
-
 Dedicated Outdoor Air System (DOAS) Diagram.png 1,040 × 585; 85 KB
-
 DER-CAM Concept.jpg 1,212 × 822; 123 KB
-
 DER-CAM Structure.png 1,342 × 673; 253 KB
-
 DigitalSTROM english.png 1,052 × 744; 142 KB
-
 DigitalSTROM.svg 1,052 × 744; 74 KB
-
 Działanie silnika WASE2.jpg 951 × 515; 104 KB
-
 Ecuacion general del balance de energia explicacion de terminos.png 1,391 × 680; 82 KB
-
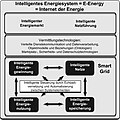 EEnergy SmartGrid.jpg 953 × 951; 168 KB
-
 EFMS.pdf 1,752 × 1,239; 63 KB
-
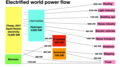 Electrified World Power Flow.png 1,600 × 900; 583 KB
-
 Elimination continuum.png 1,969 × 622; 14 KB
-
 Endergonic Reaction.svg 512 × 315; 45 KB
-
 Endotherme Reaktion mit Aktivierungsenergie.svg 1,114 × 511; 82 KB
-
 Endtherme Reaktion ohne Aktivierungsenergie.svg 906 × 356; 42 KB
-
 Energetics symbol.svg 316 × 340; 30 KB
-

-
 Energia MAS.svg 399 × 182; 20 KB
-
 Energiebilanz Motor.svg 600 × 450; 7 KB
-
 Energy 2021 United-States 0.png 3,249 × 1,911; 345 KB
-
 Energy by major sectors of the economy.gif 486 × 461; 24 KB
-
 Energy change in house I and house II.JPG 2,048 × 1,536; 217 KB
-
 Energy Consumption in China from 1996-2001.png 793 × 511; 46 KB
-
 Energy Density.PNG 885 × 633; 27 KB
-
 Energy Diagram.PNG 578 × 362; 13 KB
-
 Energy Factor Draw Patter Water Heaters.svg 1,000 × 1,000; 196 KB
-
 Energy Plus vs JCPL.jpg 960 × 720; 59 KB
-
 Energy Value.png 1,404 × 692; 161 KB
-
 Energy-Sharing final rgb 600px.jpg 600 × 425; 84 KB
-
 Esquema enerxías non renovables.png 639 × 436; 139 KB
-
 Esquema enerxías renovables.png 1,024 × 768; 190 KB
-
 ETC (zh-cn).svg 642 × 298; 42 KB
-
 ETC et.png 642 × 298; 73 KB
-
 Ethane conformations and relative energies-ru.svg 726 × 422; 2 KB
-
 Ethane conformations and relative energies.svg 733 × 435; 20 KB
-
 Excimer energy diagram.svg 330 × 215; 3 KB
-
 Exergonic Reaction-el.svg 956 × 600; 26 KB
-

-
 Generación de energía eléctrica en España (2014).png 413 × 234; 9 KB
-
 Generic energy system supplying fuels and electricity.svg 1,395 × 1,073; 145 KB
-
 Gesammtenergie-Energieumwandlung-chemische Reaktion.svg 512 × 260; 335 KB
-
 Greenhouse Effect rev es.svg 771 × 619; 15 KB
-
 Greenhouse Effect-ca.svg 1,000 × 769; 246 KB
-
 Grid energy storage fr.jpg 1,476 × 1,000; 260 KB
-
 Hbond lengths unannotated.svg 425 × 421; 35 KB
-
 Heat storage 2.png 833 × 528; 233 KB
-
 II NEWTON'S RULE MISTAKE - new physic born.JPG 2,048 × 1,536; 583 KB
-
 Inertie thermique batiment.jpg 827 × 499; 144 KB
-
 Jahresdauerlinie.svg 610 × 340; 18 KB
-
 Journal de physique théorique et appliquée, tome 4, 1905 - page 167.png 997 × 1,001; 201 KB
-
 Kardashoven eskala.png 2,000 × 1,350; 90 KB
-
 Karmann gabrielli diagram.jpg 604 × 809; 124 KB
-
 KPs01.JPG 1,208 × 759; 32 KB
-
 Kscaleprojections.png 1,115 × 647; 23 KB
-
 Major components of the Gate 5 Energy System.jpg 1,280 × 720; 196 KB
-
 Markovnikov's rule diagram.png 1,451 × 1,303; 42 KB
-
 Nachfrageschwankungen.JPG 604 × 510; 22 KB
-
 Peak-power-average-power-tau-T.png 1,034 × 839; 10 KB
-
 PiliersRevolution3selonJRifkin.jpg 1,045 × 767; 295 KB
-
 Pompa1.gif 523 × 360; 124 KB
-
 Potential energy diagram for ammonia synthesis.svg 983 × 768; 16 KB
-
 Preisgrenzen.jpg 604 × 510; 32 KB
-
 Principles energy levels.png 1,116 × 608; 145 KB
-
 Proces van multi utility.jpg 624 × 408; 31 KB
-
 Prod nette élect Suède.jpg 416 × 284; 22 KB
-
 Profil écologique de systèmes de chauffage (3).jpg 850 × 800; 87 KB
-
 Proton gradient compartment.svg 587 × 398; 33 KB
-
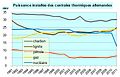 Puiss installée centrales thermq allemandes.jpg 442 × 284; 25 KB
-
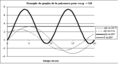 Puissance en regime sinusoïdal.png 550 × 300; 3 KB
-
 R = 2Re 2012-10-08 1809.png 751 × 546; 127 KB
-
 R = 3Re 2012-10-08 1809.png 746 × 520; 79 KB
-
 R = geo Re 2012-10-08 1809.png 747 × 521; 47 KB
-
 R=Re 2012-10-08 1808.png 750 × 522; 151 KB
-
 Rateau's steam accumulator.jpg 786 × 768; 104 KB
-
 Reaktionsenergie-endotherm Reaktion-Diagramm.svg 512 × 244; 105 KB
-
 Reaktionsenergie-endotherm Reaktion.svg 512 × 244; 40 KB
-
 Reaktionsenergie-exotherme Reaktion-Diagramm.svg 512 × 244; 107 KB
-
 Reaktionsenergie-exotherme Reaktion.svg 512 × 244; 145 KB
-
 Relation Zéro absolu, Chaleur, Agitation des particules-fr.jpg 710 × 647; 72 KB
-
 Renovable y sostenible.png 844 × 412; 52 KB
-
 Repartitions energies dans automobile.svg 658 × 622; 47 KB
-
 Ressort - energie potentielle 1.jpg 455 × 401; 18 KB
-
 Rolling horizon.png 1,614 × 381; 67 KB
-
 Rozpad nukleonowy jądra wzbudzonego.png 220 × 157; 5 KB
-
 Rozpad stanu podstawowego w rozpadzie nukleonowych.png 185 × 112; 3 KB
-
 Santral Çevrimi.png 532 × 403; 91 KB
-
 Schemat silnika A. Wąsowskiego.jpg 545 × 360; 29 KB
-
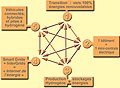
 Scheme of focuse of the sources and influx of energy.jpg 1,647 × 1,647; 1.61 MB
-
 Scheme of focuses of the sources and influx of energy.jpg 1,320 × 2,761; 1.89 MB
-
 Selbstorganisation.TIF 605 × 311; 28 KB
-

-
 Smart grid rifkin révolution commonsLamiot.jpg 768 × 1,079; 396 KB
-
 Spannung Strom am Kabel +07.png 640 × 420; 10 KB
-
 SprayDeaerator.png 287 × 269; 6 KB
-
 State generation treemap.png 2,400 × 1,500; 706 KB
-
 StressEnergyTensor contravariant.svg 805 × 488; 78 KB
-
 Stroometiket Enecototaal.png 454 × 186; 17 KB
-
 Subcritik.png 750 × 481; 168 KB
-
 Supernode Concept.jpg 960 × 720; 21 KB
-
 Swiss Solartank.gif 252 × 300; 11 KB
-

-
 Thermic-deaerator-RU.svg 800 × 600; 164 KB
-
 Thermodynamics navigation.svg 744 × 1,052; 10 KB
-
 Tlakova energia.svg 329 × 207; 16 KB
-
 Trigeneration Cycle.jpg 576 × 452; 39 KB
-
 Two-degenerate-orbital-model.png 590 × 237; 9 KB
-
 Two-non-degenerate-orbital-model.png 1,406 × 332; 19 KB
-
 Types of current translated to pt.svg 923 × 500; 17 KB
-
 Typical deaerator diag.PNG 726 × 629; 17 KB
-
 US electricity monthly.png 2,400 × 1,500; 157 KB
-
 US electricity renewable monthly.png 2,400 × 1,500; 128 KB
-
 US Electricity renewable yearly.png 2,400 × 1,500; 118 KB
-
 US Electricity treemap.png 1,800 × 1,500; 118 KB
-
 US Electricity yearly.png 2,400 × 1,500; 182 KB
-
 US Energy Consumption 2021 Major.png 1,800 × 1,500; 110 KB
-
 US Energy Consumption 2021 Renewable.png 1,800 × 1,500; 99 KB
-
 US Energy Consumption historical percap.png 2,400 × 1,500; 163 KB
-
 US Energy Consumption historical percent.png 2,400 × 1,500; 150 KB
-
 US Energy Production 2021 Major.png 1,800 × 1,500; 110 KB
-
 US Energy Production 2021 Renewable.png 1,800 × 1,500; 101 KB
-
 US Energy Sources Treemap.png 2,100 × 1,800; 117 KB
-
 US3987987figs.JPG 360 × 331; 23 KB
-
 US3987987figs1n2.JPG 325 × 500; 30 KB
-
 US6781254fig1jpg.jpg 611 × 539; 44 KB
-
 Vattenkraft i Sverige 1936-2007.jpg 865 × 693; 153 KB
-

-
 Verbrennung von Wasserstoff und Elektrolyse im Energiediagramm.svg 886 × 452; 61 KB
-
 Virialtheorem22.svg 1,057 × 830; 49 KB
-

-
 Výroba elektřiny v ČR v roce 2021 dle zdroje.png 425 × 333; 28 KB
-
 Wetterveraenderung.jpg 604 × 510; 24 KB
-
 World energy consumption by region 1970-2025.png 960 × 720; 46 KB
-
 World Energy supply.jpg 2,680 × 1,695; 368 KB
-
 Worldwide Energy Use.jpg 824 × 654; 68 KB
-
 Übergang KrF-Excimer.svg 496 × 407; 22 KB
-


_Diagram.png)


.svg)


.png)


.jpg)


.svg)


_-_im_Energiediagramm.svg)


_.svg)