Category:Economic maps of the United States
Jump to navigation
Jump to search
Subcategories
This category has the following 19 subcategories, out of 19 total.
Media in category "Economic maps of the United States"
The following 107 files are in this category, out of 107 total.
-
-
 % of Total Houses by US county, Built By Time Period, US Census.gif 1,554 × 902; 1.77 MB
-
 1991077 900 019ac (20148362186).jpg 4,145 × 2,789; 595 KB
-
 1991077 900 020ac (19986613030).jpg 4,223 × 2,866; 676 KB
-
 2006American exports.PNG 1,425 × 625; 60 KB
-
 2019 AATCC Updated Section MAP 053019.png 5,175 × 3,762; 1.42 MB
-
 Albertsonslocationsmap.PNG 1,513 × 983; 62 KB
-

-
 Arag-international-map.jpg 549 × 647; 74 KB
-
 Automobile assembly plants in the USA in 2004.png 950 × 576; 76 KB
-
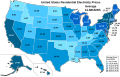
 Average Residential Price of Electricity by State.svg 990 × 627; 304 KB
-
 Average Retail Price of Electricity by State.jpg 1,513 × 983; 313 KB
-
 Average US Residential Price of Electricity by State fr.svg 990 × 627; 305 KB
-
 Average US Residential Price of Electricity by State-2012.svg 990 × 627; 298 KB
-
 Baby Bells.png 904 × 593; 54 KB
-
 Baby Bells.svg 959 × 593; 26 KB
-
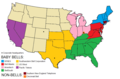
 BEA regions.png 747 × 508; 97 KB
-
 Bell telephone magazine (1922) (14568704477).jpg 2,020 × 2,302; 797 KB
-
 Bell telephone magazine (1922) (14569702640).jpg 2,816 × 1,712; 749 KB
-
 Bell telephone magazine (1922) (14569705110).jpg 1,566 × 854; 213 KB
-
 Bell telephone magazine (1922) (14569705540).jpg 2,816 × 1,892; 690 KB
-
 Bell telephone magazine (1922) (14569706080).jpg 1,184 × 2,048; 274 KB
-
 Bell telephone magazine (1922) (14569933547).jpg 2,736 × 2,058; 1.17 MB
-
 Bell telephone magazine (1922) (14569944817).jpg 1,692 × 1,134; 306 KB
-
 Bell telephone magazine (1922) (14753218791).jpg 1,718 × 1,146; 248 KB
-
 Bell telephone magazine (1922) (14754064754).jpg 2,318 × 1,464; 879 KB
-
 Bell telephone magazine (1922) (14756059322).jpg 2,512 × 1,494; 1.23 MB
-
 Bell telephone magazine (1922) (14776252463).jpg 2,640 × 1,554; 695 KB
-
 Bigrivercablecoveragearea.png 412 × 206; 9 KB
-
 Cable partner map 4-2-09.JPG 774 × 526; 171 KB
-
 Carte charbon USA 2006.png 2,500 × 2,116; 866 KB
-
 Carte gaz USA 2006.png 2,500 × 2,116; 875 KB
-
 Carte gaz USA 2006.svg 957 × 810; 343 KB
-
 Carte minerais USA 2007.png 2,500 × 2,116; 848 KB
-
 Carte minerais USA 2007.svg 957 × 810; 343 KB
-
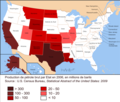 Carte pétrole USA 2006.png 2,500 × 2,116; 850 KB
-
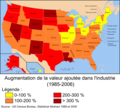 Carte valeur industrie 1985-2006.png 1,106 × 1,008; 316 KB
-
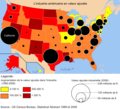 Carte valeur industrie 2006.png 1,987 × 1,810; 546 KB
-
 Cb13-33 figure4.tif 404 × 295; 181 KB
-
 Central Office Locations.png 1,056 × 816; 99 KB
-
 Centurylink DSL ISP Coverage Map.png 684 × 376; 83 KB
-
 CenturyLink network map.jpg 2,873 × 1,577; 824 KB
-
 Clason's industrial map of Colorado. - DPLA - 3f383570e95ce903ee5716228257a62d.jpg 9,000 × 7,552; 14.84 MB
-
 Comparison between U.S. states and countries by GDP in 2012.jpg 1,513 × 983; 240 KB
-
 Container-deposit legislation in US and Canadian states.svg 512 × 512; 117 KB
-
 Cooperative economic insect report (1968) (20669949236).jpg 3,308 × 1,880; 934 KB
-
 Craft Breweries Per Capita (US).png 1,100 × 680; 121 KB
-
 Craft Breweries Per Capita (US).svg 959 × 593; 107 KB
-
 Data on food deserts.png 1,034 × 556; 795 KB
-
 Detasseling Map.png 1,256 × 1,011; 167 KB
-
 Distribution of Farming, Lumbering, and Mining Industries in Washington, 1914.jpg 1,777 × 1,187; 1.05 MB
-
 DuMont Affiliates 1949.png 882 × 574; 48 KB
-
 Family Promise Affiliate Map.jpg 3,400 × 2,200; 677 KB
-
 FederalNetperCapita2014.png 677 × 514; 52 KB
-
 Figure05-teachers wages.png 560 × 510; 60 KB
-
 Google Fiber Map.jpeg 1,920 × 1,080; 378 KB
-
 Harristeeterstates.PNG 841 × 580; 27 KB
-
 Highmhhimap.png 300 × 221; 74 KB
-
 Highpcimap.png 300 × 221; 74 KB
-
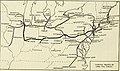
 Highways USA 1825.png 938 × 762; 188 KB
-
 LgTelephoneMap.jpg 22,829 × 15,502; 99.54 MB
-
 Love'sTravelStopMap.JPG 640 × 480; 53 KB
-
 Lowmhhimap.svg 986 × 624; 1.26 MB
-
 Lowpcimap.png 300 × 221; 75 KB
-
 Lowpcimap.svg 986 × 624; 1.26 MB
-
 Map of housing conditions, Seattle, 1960 (49465003892).jpg 1,287 × 1,971; 228 KB
-
 Map of mafia in the us.png 5,285 × 3,762; 1.28 MB
-
 Map of stores owned by Albertson's in the United States.png 2,560 × 1,583; 347 KB
-
 Map of USA highlighting states with no income tax on wages.svg 959 × 593; 78 KB
-
 Map of USA highlighting states with no income tax.svg 959 × 593; 78 KB
-
 Map of WW2 Shipyards building DD.jpg 853 × 630; 94 KB
-
 MapSEPT2011.jpg 1,656 × 1,740; 2.53 MB
-
 Market.svg 960 × 500; 349 KB
-
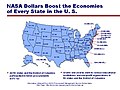 NASA dollars.jpg 720 × 540; 74 KB
-
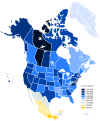 North America first level political divisions by income.svg 1,789 × 2,154; 537 KB
-
 NUCA Map w logo 11-19.png 1,500 × 1,130; 358 KB
-
 NUCA map.png 1,000 × 667; 122 KB
-
 Overfished US stocks 2010.png 1,016 × 701; 287 KB
-
 Paid sick leave laws in the United States.svg 959 × 593; 58 KB
-
 Pathways Out of Poverty Locations.jpg 1,053 × 814; 60 KB
-
 Per capita personal income change in metropolitan counties, 1980-2002.png 1,220 × 861; 171 KB
-
 Poverty by U.S. state.svg 1,199 × 593; 71 KB
-
 Rust and Sun Belts.png 800 × 500; 98 KB
-
 Rust-belt-map.jpg 280 × 183; 19 KB
-
 Smile FM stations.png 1,568 × 1,808; 262 KB
-
 Spoke Hub Distribution.svg 512 × 292; 125 KB
-
 Stroke belt.svg 959 × 593; 90 KB
-
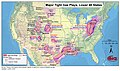 Tight natural gas plays in the lower 48 states of the USA.jpg 2,200 × 1,300; 1.71 MB
-
 Total mfctrg jobs change 54-02.png 1,236 × 857; 158 KB
-
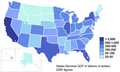
 U.S. GDP by state 2008 (current dollars).jpg 590 × 530; 139 KB
-
 U.S. states by GDP per capita, 2017.jpg 5,175 × 2,872; 1.86 MB
-
 U.S.A. states by GDP per capita in 2015.jpg 5,400 × 3,585; 1.23 MB
-
 United States by Gini Coefficient.png 935 × 722; 193 KB
-
 United States Slavery Map 1860-sw.jpg 1,200 × 672; 167 KB
-
 United States uranium resources map LOC 79692715.jpg 23,526 × 14,722; 24.24 MB
-
 Urbansim-map.png 280 × 360; 222 KB
-
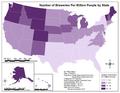 US Breweries Per One Million People By State 2012.pdf 1,650 × 1,275; 377 KB
-
 US GDP per capita by state 2010 (current dollars).svg 512 × 240; 64 KB
-
 US State Credit Ratings Fitch January 2017.svg 959 × 593; 32 KB
-
 US State Credit Ratings Moodys January 2017.svg 959 × 593; 32 KB
-
 US State Credit Ratings S&P January 2017.svg 959 × 593; 32 KB
-
 US states by GDP per capita (nominal).PNG 945 × 583; 25 KB
-
 US states by percent union members (2017).svg 959 × 593; 32 KB
-
 USA 2008 workforce exponent by county.svg 555 × 352; 1.37 MB
-
 USA home appreciation 1998 2006.svg 959 × 593; 332 KB
-
 USA states nominal gdp 2005.PNG 960 × 580; 34 KB
-
 USA states nominal gdp.PNG 960 × 580; 36 KB


.jpg)
.jpg)


_(19366177585).jpg)


_(14568704477).jpg)
_(14569702640).jpg)
_(14569705110).jpg)
_(14569705540).jpg)
_(14569706080).jpg)
_(14569933547).jpg)
_(14569944817).jpg)
_(14753218791).jpg)
_(14754064754).jpg)
_(14756059322).jpg)
_(14776252463).jpg)


_(20669949236).jpg)
.png)
.svg)


.jpg)


.jpg)


.svg)


.PNG)
.svg)


