Category:Created with Microsoft Excel
Jump to navigation
Jump to search
Wikimedia category | |||||
| Upload media | |||||
| Instance of | |||||
|---|---|---|---|---|---|
| Category combines topics |
| ||||
| Microsoft Excel | |||||
spreadsheet editor, part of Microsoft 365  Γράφημα στο Excel. .svg) | |||||
| Instance of | |||||
| Has use | |||||
| Developer | |||||
| Operating system | |||||
| Software version identifier |
| ||||
| Inception |
| ||||
| official website | |||||
| |||||
Media in category "Created with Microsoft Excel"
The following 200 files are in this category, out of 690 total.
(previous page) (next page)-

-

-

-
 0013 - Leaning-Brick-Pile - A.png 967 × 950; 59 KB
-
 0013 - Leaning-Brick-Pile-004.png 979 × 958; 47 KB
-
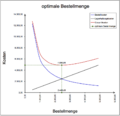 0014 - Optimale-Bestellmenge - A.png 870 × 844; 86 KB
-
 0015 - Leverage-Effekt-0..png 1,068 × 954; 38 KB
-
 0015 - Leverage-Effekt-1.png 1,068 × 955; 46 KB
-
 0015 - Leverage-Effekt-2.png 1,071 × 958; 42 KB
-
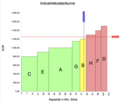 0016 - Industriekostenkurve.png 940 × 801; 60 KB
-
 1. + 2. Impfung gegen COVID-19 in Deutschland registriert (Risklayer).svg 10,397 × 3,270; 22 KB
-
 10nm Node Patterning Cost Comparison.png 713 × 267; 10 KB
-
 16 nm hp Patterning Cost Comparison.png 751 × 288; 13 KB
-
 1D SADP SIM vs SID.png 346 × 190; 3 KB
-
 1D SAQP SID.png 451 × 552; 12 KB
-
 1D SID SAQP.png 311 × 378; 5 KB
-
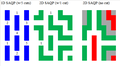 1D vs 2D SAQP.png 501 × 274; 10 KB
-
 1x nm hp double patterned cuts.png 360 × 485; 10 KB
-
 2005kmt election.jpg 315 × 284; 14 KB
-
 2008 GOP Iowa 6 Months.png 1,325 × 802; 91 KB
-
 2008 Polling YTD.jpg 1,225 × 670; 121 KB
-
 2008 Polling.jpg 1,225 × 670; 127 KB
-
 2015 South Korea Population Pyramid.png 560 × 705; 25 KB
-
 2015 Turkey opinion polls.png 1,436 × 708; 117 KB
-
 2016 Sri Lanka Defence Budget.png 1,344 × 728; 43 KB
-
 22 nm pitch EUV cuts.png 421 × 316; 7 KB
-
 27 nm pitch cut patterning.png 241 × 441; 4 KB
-
 2D dense pattern rounding.png 359 × 324; 10 KB
-
 2D SAQP with reduced masks.png 676 × 505; 20 KB
-
 2X SID SADP 2.png 841 × 295; 4 KB
-
 2X SID SADP.png 332 × 291; 4 KB
-
 3-color SAQP.png 373 × 277; 5 KB
-
 5and6legiseatcompar.png 513 × 407; 18 KB
-
 5nm Node Patterning Cost Comparison.png 909 × 309; 17 KB
-
 6s blur definition.png 482 × 286; 11 KB
-
 6s EUV blur vs linewidth.png 540 × 284; 13 KB
-
 7-Tage-Inzidenz COVID-19 in Hof.svg 2,860 × 1,042; 12 KB
-

-

-
 800M Freestyle Swimming World Record Progression.png 838 × 643; 23 KB
-
 9 nm half-pitch EUV cuts.png 482 × 269; 8 KB
-
 A graph denoting the changing population of Bellerby over time.jpg 481 × 289; 34 KB
-
 A graph showing the changing population of Nether Silton..png 614 × 360; 17 KB
-
 Aerial image of dense lines vs. half-pitch (EUV).png 672 × 430; 18 KB
-
 AirmassFormulaePlots.png 1,000 × 695; 547 KB
-
 Alastair Cook test batting career v1.png 1,220 × 647; 19 KB
-
 Alastair Cook test batting career v2.png 1,221 × 649; 21 KB
-
 Alevitenverteilung.png 792 × 458; 23 KB
-
 Aliquote IRPEF nazionali (1973-2022) - Italy's national Income Tax rates (1973-2022).png 7,031 × 3,749; 666 KB
-
 ALLBUS, exemplary analysis of time series data 1980-2012, line chart.jpeg 1,289 × 523; 175 KB
-
 Altimetria Ferrocarril Directo Madrid - Burgos.jpg 980 × 641; 139 KB
-
 Am241 spectra HEXITEC.png 642 × 426; 56 KB
-
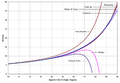
 Amdahl-law.jpg 530 × 410; 37 KB
-
 Andrew Strauss ODI batting career v1.png 1,339 × 524; 18 KB
-
 Andrew Strauss ODI batting career v2.png 1,340 × 525; 20 KB
-
 Andrew Strauss test batting career v1.png 888 × 489; 13 KB
-
 Andrew Strauss test batting career v2.png 1,136 × 626; 20 KB
-
 AnimeFilms10BillionYen.png 512 × 341; 48 KB
-
 Anticipo d'accensione 3D.png 729 × 560; 18 KB
-
 Anzahl der Dateien in Wikimedia Commons über Zeit.svg 3,331 × 1,995; 109 KB
-
 AP Exams Taken in 2013.svg 792 × 612; 354 KB
-
 Arbcomduration.png 481 × 288; 15 KB
-
 Ariel daily distance run 1866 tea race.jpg 371 × 424; 45 KB
-
 Array-specific illuminations.png 691 × 251; 9 KB
-
 Article half-life.png 755 × 637; 26 KB
-
 Ascolti TV in Italia (1987-) -- Audience viewership of TV programs in Italy (1987-).png 8,429 × 6,187; 2.44 MB
-
 Ashwell Prince test batting career v1.png 1,135 × 524; 17 KB
-
 Ashwell Prince test batting career v2.png 1,136 × 525; 18 KB
-
 AsianYNFirstWeeks.svg 883 × 325; 22 KB
-
 ASML EUV Throughput vs Source Power.png 481 × 289; 8 KB
-
 Athabasca Oil Sands Planned Production.png 1,409 × 959; 153 KB
-
 Australian large car sales 1991 onwards.png 541 × 446; 18 KB
-
 Autism Prevalence to 2014.png 1,122 × 792; 25 KB
-
 AV-TEST.org - MSE results on chart.png 1,224 × 803; 47 KB
-
 Avvenire - diffusione media in confronto (1976-).png 4,552 × 3,559; 936 KB
-
 Ballistische Flugbahn Tabelle.png 1,074 × 631; 75 KB
-
 Beneficial Impact Of Corporate Actions.jpg 977 × 446; 48 KB
-
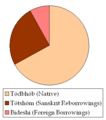 Bengali Vocabulary.png 364 × 411; 6 KB
-
 Besucherzahlen Aven d'Orgnac.PNG 1,419 × 859; 52 KB
-
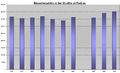
 Besucherzahlen Eberstadt, Jahr 2007.PNG 1,000 × 750; 27 KB
-
 Besucherzahlen Gouffre de Padirac.PNG 1,419 × 859; 52 KB
-
 Bill Johnston graph 1948.png 540 × 298; 10 KB
-
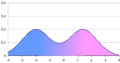 Bimodal.png 350 × 184; 5 KB
-
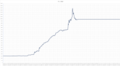
 Blacktest score rise.jpg 400 × 310; 22 KB
-
 Blnguyencount.jpg 390 × 289; 29 KB
-
 Budapest Population graph.PNG 601 × 368; 15 KB
-
 Bundestagswahl 2013, Erststimmen, absolut, 239 Hof.svg 2,539 × 982; 11 KB
-
 Bundestagswahl 2013, Erststimmen, relativ, 239 Hof.svg 2,540 × 983; 10 KB
-
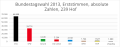
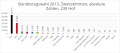 Bundestagswahl 2013, Zweitstimmen, absolut, 239 Hof.svg 2,539 × 1,117; 31 KB
-
 Bundestagswahl 2013, Zweitstimmen, relativ, 239 Hof.svg 2,539 × 1,117; 33 KB
-
 C2c passenger numbers.png 1,060 × 624; 27 KB
-
 C6orf222 evolution rate.png 960 × 720; 9 KB
-
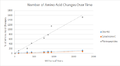 C8orf82 % Amino Acid Changes Over Time.png 629 × 348; 13 KB
-
 CAD USD Exchange Rates.png 740 × 384; 7 KB
-
 Cambridge Attendance Table.JPG 1,207 × 489; 75 KB
-
 Captura excel 2.JPG 612 × 402; 43 KB
-
 CD 3s vs dose.png 589 × 384; 22 KB
-
 CEO pay v. average slub.png 754 × 454; 29 KB
-
 Change Lira (LIT-ITL) - Mark (DEM) - 1955-2022.png 5,939 × 3,259; 638 KB
-
 CheadleGraph.png 1,142 × 668; 17 KB
-
 Chicken McNuggets Problem - graphical representation.jpg 441 × 383; 70 KB
-
 Chinese-Kazakh bilateral trade - hans.png 1,129 × 757; 69 KB
-
 Chinese-Kazakh bilateral trade - hant.png 721 × 483; 39 KB
-
 CIE1931 2graden.png 966 × 603; 9 KB
-
 Clubs rugby XV.jpg 2,195 × 1,381; 177 KB
-
 Clubs rugbyXV.jpg 2,107 × 1,381; 164 KB
-
 Cohen and Jedynak approximations.gif 503 × 304; 7 KB
-
 Comparative force-time response of bare and lagged Ni-Ti shape memory alloy.png 1,822 × 690; 442 KB
-
 Complementary polarity exposures.png 1,231 × 465; 23 KB
-
 Compound interest.gif 786 × 675; 37 KB
-
 Contact hole optimum EUV illumination vs pitch.png 481 × 290; 9 KB
-
 Converging number of cuts.png 482 × 295; 10 KB
-

-
 Copgrove Population between 1811 and 1961.jpg 481 × 289; 35 KB
-
 Corriere della Sera - diffusione media giornaliera (1976-).png 4,552 × 2,929; 384 KB
-

-
 COVID-19 Stadtkreis Hof 7-Tage-Inzidenz pro 100K Einwohner 2020.svg 3,902 × 1,285; 15 KB
-
 COVID-19 Stadtkreis Hof 7-Tage-Inzidenz pro 100K Einwohner 2021.svg 4,160 × 1,302; 16 KB
-
 COVID-19 Stadtkreis Hof Fallzahlen kumuliert 2020.svg 3,903 × 1,285; 17 KB
-
 COVID-19 Stadtkreis Hof Fallzahlen kumuliert 2021.svg 4,160 × 1,302; 19 KB
-
 COVID-19 Stadtkreis Hof Fallzahlen pro Tag 2020.svg 3,900 × 1,294; 18 KB
-
 COVID-19 Stadtkreis Hof Fallzahlen pro Tag 2021.svg 4,160 × 1,302; 28 KB
-
 COVID-19 Stadtkreis Hof Fallzahlen pro Tag ab 2020 nach Alter.svg 26,226 × 6,736; 2.18 MB
-
 CPI budget.png 683 × 467; 21 KB
-
 Cut or block mask.png 400 × 255; 2 KB
-
 Cut Redistribution.png 435 × 1,051; 14 KB
-
 Cuts vs Connections.png 641 × 306; 10 KB
-
 D5 Tanabe-Sugano diagram.png 2,096 × 2,696; 326 KB
-
 D7 Tanabe-Sugano diagram.png 2,200 × 2,829; 353 KB
-
 Data storage increase at CERN DE.svg 1,856 × 993; 9 KB
-
 Data storage increase at CERN EN.svg 1,855 × 993; 9 KB
-
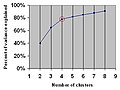 DataClustering ElbowCriterion.JPG 355 × 266; 12 KB
-
 Deaths by age group fixed.png 1,296 × 767; 33 KB
-
 Defensieuitgaven 1934-1938.png 551 × 376; 17 KB
-
 Dense line bridging vs pitch.png 634 × 320; 11 KB
-

-
 Derivative sum Lorentzians.png 427 × 313; 3 KB
-
 Detail poměru wikipedistů k wikiskupinám.jpg 517 × 352; 22 KB
-
 Diagramm 7-Tage-Inzidenz COVID-19-Neuinfektionen Deutschland Risklayer.svg 10,397 × 3,273; 27 KB
-
 Diagramm tgl neue Todesfälle COVID-19 GER Risklayer.svg 10,396 × 3,216; 55 KB
-
 Diagramm – Festplattenkapazitäten ab 1956 (logarithmische Skalierung).svg 3,646 × 1,295; 28 KB
-
 Different multipatterning techniques.png 767 × 1,277; 27 KB
-
 Diffusione a confronto -- Il Sole 24 Ore - Il Giorno (1976-).png 4,220 × 2,886; 355 KB
-

-

-

-

-
 Diffusione totale periodici in Italia - Total circulation of newspapers in Italy.png 6,770 × 8,622; 1.91 MB
-
 DNH Forest Cover Pie Chart.jpg 909 × 559; 47 KB
-
 DNH Forest Type Pie Chart.jpg 709 × 514; 28 KB
-
 DO ACMGE residents as percentage of USMD residents.jpg 819 × 676; 44 KB
-
 DO residents in ACGME total.jpg 748 × 646; 34 KB
-
 Dose dependence of EUV shot noise.png 540 × 284; 13 KB
-
 Double SADP.png 968 × 316; 4 KB
-
 Double-dipole lithography.png 218 × 349; 2 KB
-
 Downtown Gaming.png 912 × 662; 91 KB
-
 DRAM AA pitch vs WL pitch.png 481 × 289; 16 KB
-
 DrawingML example.png 688 × 436; 70 KB
-
 Drupal release timeline.png 1,093 × 480; 24 KB
-
 Dubinin-Astakhov Curves.png 676 × 443; 65 KB
-
 DuckworthLewisEng.png 370 × 275; 11 KB
-
 E hoch minus aX.PNG 471 × 329; 46 KB
-
 EastEnders - Kat's affair poll results.png 978 × 639; 58 KB
-
 Edge roughness from shot noise.png 462 × 485; 5 KB
-
 Election results and opinion polls in Spain (1993-1996).png 781 × 501; 33 KB
-
 Election results and opinion polls in Spain (2004-2008).png 1,201 × 582; 67 KB
-
 Election results and opinion polls in Spain since Nov 2011.png 1,201 × 582; 57 KB
-
 ElectionMonthlyAverageGraphSpain2000.png 1,201 × 582; 66 KB
-
 ElectionMonthlyAverageGraphSpain2004.png 1,201 × 583; 83 KB
-
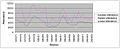
 Electric Energy Consumption - Monthly Deviations from Average.jpg 389 × 289; 32 KB
-
 Electricity India 1985-2012.png 635 × 325; 43 KB
-
 Electricity production in Canada.PNG 684 × 446; 25 KB
-
 Electricity production in France.PNG 795 × 584; 26 KB
-
 Electricity production in Germany.PNG 684 × 446; 17 KB
-
 Electricity production in Japan.PNG 638 × 502; 22 KB
-
 Electricity production in South Korea.PNG 634 × 466; 14 KB
-
 Electricity production in Spain.PNG 985 × 648; 40 KB
-
 Electricity production in the UK.PNG 800 × 600; 36 KB
-
 Electricity production in the USA.PNG 634 × 466; 24 KB
-
 Empirical atomic radius trends-sr.png 609 × 456; 35 KB
-
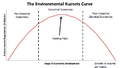 Environmntal Kuznets Curve.png 461 × 261; 34 KB
-
 Ernie Toshack graph 1948.png 553 × 281; 8 KB
-
 EU-Wahl 2014, absolut, Hof.svg 2,736 × 982; 38 KB
-
 EU-Wahl 2014, relativ, Hof.svg 2,737 × 983; 39 KB
-
 EUV 10nm node pattern shift through focus.png 532 × 216; 21 KB
-
 EUV 3s shot noise.png 480 × 289; 10 KB
-
 EUV angles of incidence.png 543 × 293; 17 KB
-
 EUV AOI delta.png 485 × 311; 17 KB
-
 EUV collector degradation vs time.png 569 × 289; 10 KB
-
 EUV defocus pattern shift vs pitch.png 685 × 306; 15 KB
-
 EUV dipole relative pattern shift vs. focus.png 480 × 289; 28 KB
-
 EUV DoF vs substrate photoemission.png 479 × 288; 5 KB
-
 EUV dose to print contacts.png 481 × 288; 10 KB
-
 EUV H-V bias vs half-pitch.png 483 × 295; 9 KB
-
 EUV mask slope effect.png 480 × 289; 9 KB
-
 EUV multilayer reflectivity vs angle and polarization.png 582 × 420; 20 KB
-
 EUV multilayer reflectivity.png 603 × 443; 24 KB
-
 EUV pattern placement error.png 481 × 266; 10 KB
-
 EUV pattern shift thru-pitch and thru-focus.png 457 × 350; 14 KB
-
 EUV pattern shift vs focus.png 460 × 288; 9 KB
.png)
.png)
.png)


.png)


_-_Italy%27s_national_Income_Tax_rates_(1973-2022).png)


_--_Audience_viewership_of_TV_programs_in_Italy_(1987-).png)


.png)


_-_Mark_(DEM)_-_1955-2022.png)


.png)


.png)
_-_2022.png)
_-_Italian_monthly_newspapers_circulation_(1976-2020).png)
_-_Italian_daily_newspaper_circulation_(1976-2020).png)
_-_Italian_weekly_newspaper_circulation_(1976-2020).png)


.png)
.png)


.svg)
_ab_11.03.2020.svg)
_ab_07.03.2020.svg)
.svg)