Category:Choropleth maps of the world
Jump to navigation
Jump to search
Before sorting maps into this category, please understand the definitions of choropleth maps, for example summarized in the parent category.
Media in category "Choropleth maps of the world"
The following 70 files are in this category, out of 70 total.
-

-

-
 2017, Coeficiente de Gini, Mapa del mundo.svg 1,050 × 570; 3.66 MB
-
 A Choropleth Map of the Concentration of GWAS Participant Recruitment.webp 2,032 × 981; 106 KB
-
 Annual CO2 emissions from deforestation, global.png 1,746 × 1,234; 360 KB
-
 Anti-spam by CleanTalk 1.png 1,177 × 509; 50 KB
-
 Babaner.png 534 × 131; 34 KB
-
 Bevölkerungsdichte-Welt.png 1,357 × 628; 34 KB
-
 Botnet infection of Wifatch from loot myself twitter post.png 598 × 336; 98 KB
-
 Bribery-rates Our World in Data 2016.png 3,400 × 2,400; 707 KB
-
 Carte de la consommation de bière.png 1,724 × 1,072; 241 KB
-
 Carte monde.png 1,169 × 484; 141 KB
-
 Cartog anim.gif 2,976 × 1,267; 10.89 MB
-
 CO2 per capita per country.png 800 × 370; 72 KB
-
 Coefficient de Gini, année de référence variable.png 1,200 × 743; 280 KB
-
 Costs and benefits of implementation of the 11 selected measures in 2015.webp 2,060 × 2,217; 358 KB
-
 Countries by GDP (PPP) per capita in 2017.png 6,300 × 3,082; 1.93 MB
-
 Countries by GDP (PPP) per capita in 2019.png 5,990 × 2,740; 1.54 MB
-
 Countries by GDP (PPP) per capita in 2020.png 5,990 × 2,740; 1.25 MB
-
 Countries by GNI (nominal) per capita in 2018.png 6,218 × 3,248; 2.06 MB
-
 Countries by GNI (nominal, Atlas method) per capita in 2016.png 6,300 × 3,408; 2.03 MB
-
 Countries by GNI (PPP) per capita in 2016.png 6,470 × 3,318; 3.2 MB
-
 Countries by gross median per-capita income in Int$ (PPP).png 6,300 × 3,411; 2 MB
-
 Countries by HDI.png 6,460 × 3,403; 1.79 MB
-
 Countries by mean wealth per adult (2019).png 5,928 × 2,730; 1.86 MB
-
 Countries by mean wealth per adult in 2018.png 6,105 × 3,023; 2.08 MB
-
 Countriesauthoritarian.png 1,518 × 771; 315 KB
-
 Covid19DataBot-Case-Data-World.svg 2,754 × 1,398; 1.05 MB
-
 Crude Birth Rate Map by Country.svg 1,104 × 566; 1.67 MB
-
 Destination of UK ODA per capita.svg 2,560 × 1,314; 1.05 MB
-
 GINI coefficient 2009 blue.svg 863 × 443; 1.63 MB
-
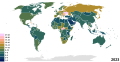
 Gini coefficient 2021.png 1,076 × 772; 132 KB
-
 Gini Coefficient for 2007 2008.svg 914 × 403; 1.37 MB
-
 Gini Coefficient of Wealth Inequality source (2019).png 6,300 × 3,424; 1.43 MB
-
 Gini Coefficient World CIA Report 2009-1.png 1,425 × 625; 67 KB
-
 Gini Coefficient World CIA Report 2009.png 1,425 × 625; 70 KB
-
 Gini Coefficient World CIA Report 2009.svg 940 × 477; 1.7 MB
-
 Gini Coefficient World CIA Report.svg 512 × 260; 796 KB
-
 Gini Coefficient World Human Development Report 2007-2008.png 1,800 × 820; 185 KB
-
 Gini coefficient world2021.png 1,059 × 772; 179 KB
-
 Gini coeficient OECD.png 800 × 411; 87 KB
-
 GINI Index SVG.svg 856 × 433; 1.39 MB
-
 GINI index World Bank up to 2018.png 6,300 × 3,354; 1.85 MB
-
 GINI index World Bank up to 2018.svg 512 × 260; 805 KB
-
 Gini Koeffizient World Human Development Report 2007-2008.png 1,425 × 625; 63 KB
-
 GINI retouched legend.gif 1,425 × 625; 39 KB
-
 Gini with key.svg 1,003 × 438; 1.39 MB
-
 GINIretouchedcolors.png 1,425 × 625; 47 KB
-
 Global Forest Area.svg 792 × 612; 447 KB
-
 IALA Maritime Buoyage System Regions.svg 2,754 × 1,398; 1.21 MB
-
 Life Expectancy, Population Reference Bureau, Current.svg 1,104 × 566; 1.67 MB
-
 Map of countries by GINI coefficient (1990 to 2020).svg 2,192 × 1,135; 1.63 MB
-
 Mapa de la inequidad-gini.svg 863 × 443; 1.68 MB
-
 Mortality Rate Map by Country.svg 1,104 × 566; 1.68 MB
-
 Net Migration Rate, Population Reference Bureau, Current.svg 1,104 × 566; 1.67 MB
-
 Real GDP growth rate (%) in 2017.png 6,300 × 3,520; 2.11 MB
-
 Road density per country.png 1,425 × 625; 40 KB
-
 Teacon1.png 696 × 372; 128 KB
-
 Wealth gini 2013 .svg 1,488 × 744; 6.7 MB
-
 Wealth gini 2013.svg 1,488 × 744; 6.7 MB
-
 Wealth Gini Map 2013.png 9,921 × 4,960; 3.47 MB
-
 World Bank Gini Map.svg 1,003 × 438; 1.39 MB
-
 World Income Gini Map (2013).svg 1,488 × 709; 6.71 MB
-
 World Map Gini coefficient 2004.png 1,357 × 628; 47 KB
-
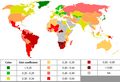 World Map Gini coefficient with legend 2.png 1,272 × 864; 72 KB
-
 World Map Gini coefficient.png 1,357 × 679; 230 KB
-
 World Map Gini coefficient.svg 4,500 × 2,234; 2.38 MB
-
 World Map Gini coefficient02.png 1,357 × 628; 29 KB
-
 World map of median wealth per adult by country. Credit Suisse. 2019 publication.png 5,990 × 2,751; 1.98 MB
-
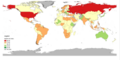
 Коэффициент Джини 2009.png 1,289 × 621; 57 KB
.svg)


_per_capita_in_2017.png)
_per_capita_in_2019.png)
_per_capita_in_2020.png)
_per_capita_in_2018.png)
_per_capita_in_2016.png)
_per_capita_in_2016.png)
.png)

.png)


.png)


.svg)


_in_2017.png)


.svg)


