Category:Charts showing data through 2014
Jump to navigation
Jump to search
Deutsch: Statistiken bis zu und einschließlich 2014. Viele Grafiken fehlen hier noch – bitte hinzufügen.
English: Charts showing data up to and including 2014.
- Many charts are still missing – please help categorizing charts, e.g. from here. Outdated charts can often be updated. Only charts on notable subjects with specified data source(s) should be included.
Media in category "Charts showing data through 2014"
The following 40 files are in this category, out of 40 total.
-

-

-
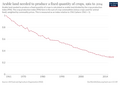 Arable-land-pin (OWID 0090).png 850 × 600; 57 KB
-
 Banana production by region, OWID.svg 850 × 600; 41 KB
-
 Canadian Oil Production since 1960.svg 512 × 512; 20 KB
-
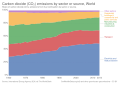 Carbon dioxide (CO₂) emissions by sector or source, OWID.svg 850 × 600; 17 KB
-
 Crop yields of cereals and pulses, OWID.svg 850 × 600; 13 KB
-

-
 Electricity share by fuel source, OWID.svg 850 × 600; 15 KB
-
 FAO projections of arable land to 2050, OWID.svg 850 × 600; 8 KB
-
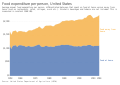 Food expenditure per person, OWID.svg 850 × 600; 8 KB
-
 GET en 2A5 feed-in tariffs grow.png 1,001 × 769; 67 KB
-
 Global agricultural land use by major crop type, OWID.svg 850 × 600; 13 KB
-
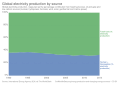 Global electricity production by source, OWID.svg 850 × 600; 7 KB
-
 Global freshwater use over the long-run, OWID.svg 850 × 600; 8 KB
-
 Insecticide use, OWID.svg 850 × 600; 9 KB
-
 Literate and illiterate world population over time.png 1,200 × 800; 93 KB
-
 Measles-vaccine-coverage-worldwide-vs-measles-cases-worldwide.jpg 3,400 × 2,400; 185 KB
-

-
 Number of people living in urban slum households, OWID.svg 850 × 600; 6 KB
-

-
 Organic agricultural area, OWID.svg 850 × 600; 6 KB
-

-
 Out-of-school girls of primary school age by world region, OWID.svg 850 × 600; 15 KB
-
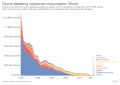 Ozone-depleting substance consumption, OWID.svg 850 × 600; 14 KB
-
 Ozone-depleting substance emissions, OWID.svg 850 × 600; 10 KB
-
 Phosphate fertilizer consumption, OWID.svg 850 × 600; 24 KB
-
 Phosphate fertilizer production, OWID.svg 850 × 600; 23 KB
-

-

-
 Tea production by region, OWID.svg 850 × 600; 26 KB
-
 The value of global exports, OWID.svg 850 × 600; 14 KB
-
 The World as 100 People.png 5,343 × 3,663; 444 KB
-

-
 Total wealth per capita, OWID.svg 850 × 600; 13 KB
-
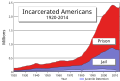 US incarceration timeline-clean.svg 693 × 464; 11 KB
-
 Wealth per capita by country grouping, OWID.svg 850 × 600; 14 KB
-
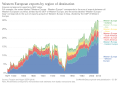 Western European exports by region of destination, OWID.svg 850 × 600; 52 KB
-
 Wildlife-exports (OWID 1101).png 850 × 600; 102 KB
-
 World Health Expenditure as Share of Global GDP, OWID.svg 850 × 600; 6 KB

,_OWID.svg)
.png)


_emissions_by_sector_or_source,_OWID.svg)


,_OWID.svg)


,_OWID.svg)


.png)
