Category:Candlestick charts
Jump to navigation
Jump to search
financial chart  | |||||
| Upload media | |||||
| Instance of | |||||
|---|---|---|---|---|---|
| Facet of | |||||
| Said to be the same as | Open-high-low-close chart (close match) | ||||
| |||||
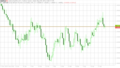
A candlestick chart is a style of bar-chart used primarily to describe price movements of an equity over time. It is a combination of a line chart and a bar chart, in that each bar represents the range of price movement over a given time interval.
Subcategories
This category has only the following subcategory.
S
- Scheme of candlestick charts (19 F)
Media in category "Candlestick charts"
The following 200 files are in this category, out of 276 total.
(previous page) (next page)-
 4JBbIbVWZ.png 1,032 × 582; 65 KB
-
 4JM0HbVWW (1).png 1,032 × 582; 61 KB
-
 A chart to scalar resistance triangle.png 787 × 462; 28 KB
-
 Analisi tecnica bearish engulfing.PNG 379 × 254; 5 KB
-
 Analisi tecnica bullish engulfing.PNG 333 × 212; 4 KB
-
 Analisi tecnica candlestick 1.png 994 × 649; 8 KB
-
 Analisi tecnica candlestick 2.png 994 × 649; 12 KB
-
 Analisi tecnica dark cloud cover.PNG 406 × 266; 6 KB
-
 Analisi tecnica deliberation.PNG 223 × 505; 5 KB
-
 Analisi tecnica falling three methods.PNG 135 × 97; 586 bytes
-
 Analisi tecnica hammer.PNG 199 × 163; 2 KB
-
 Analisi tecnica hanging man.PNG 413 × 173; 3 KB
-
 Analisi tecnica harami.PNG 508 × 306; 6 KB
-
 Analisi tecnica inv hammer.PNG 365 × 209; 3 KB
-
 Analisi tecnica piercing line.PNG 321 × 210; 3 KB
-
 Analisi tecnica rising three methods v2.PNG 134 × 101; 706 bytes
-
 Analisi tecnica shooting star.PNG 376 × 247; 4 KB
-
 Analisi tecnica stick sandwich.PNG 360 × 304; 5 KB
-
 Analisi tecnica three black crows.PNG 489 × 395; 7 KB
-
 Analisi tecnica three white soldiers.PNG 489 × 395; 8 KB
-
 Analisi tecnica thrusting line.PNG 465 × 510; 9 KB
-
 Apple Inc Candle Stick Chart Mar 2009 to May 2011.png 1,132 × 623; 22 KB
-
 Bear-pennant.jpg 500 × 333; 82 KB
-
 Bearish Engulfing Pattern.jpg 117 × 137; 4 KB
-
 Bearish-3-method-formation.svg 100 × 100; 1 KB
-
 Bearish-harami-cross.svg 100 × 100; 527 bytes
-
 Bearish-harami.svg 100 × 100; 549 bytes
-
 Big-black-candle.svg 100 × 100; 315 bytes
-
 Big-white-candle.svg 100 × 100; 321 bytes
-
 Black-body.svg 100 × 100; 315 bytes
-
 Bullish Engulfing Pattern.jpg 228 × 376; 19 KB
-
 Bullish-3-method-formation.svg 100 × 100; 1 KB
-
 Bullish-harami-cross.svg 100 × 100; 521 bytes
-
 Bullish-harami.svg 100 × 100; 549 bytes
-
 Candle black closing marubozu.png 100 × 542; 2 KB
-
 Candle black closing marubozu.svg 100 × 541; 938 bytes
-
 Candle black opening marubozu.png 100 × 542; 2 KB
-
 Candle black opening marubozu.svg 100 × 541; 943 bytes
-
 Candle black shortday.svg 124 × 821; 1 KB
-
 Candle black.svg 124 × 821; 3 KB
-
 Candle doji dragonfly.svg 115 × 824; 925 bytes
-
 Candle doji gravestone.svg 115 × 824; 932 bytes
-
 Candle doji longlegged.svg 126 × 820; 1 KB
-
 Candle doji neutral.svg 115 × 824; 1 KB
-
 Candle doji neutral2.jpg 2,000 × 14,330; 514 KB
-
 Candle doji neutral2.svg 200 × 831; 1 KB
-
 Candle doji neutral3.jpg 2,000 × 14,330; 514 KB
-
 Candle doji neutral3.svg 200 × 831; 1 KB
-
 Candle hammer.svg 115 × 824; 925 bytes
-
 Candle hangingman.svg 115 × 824; 2 KB
-
 Candle inverted hammer.svg 115 × 824; 930 bytes
-
 Candle lowershadow.svg 125 × 830; 2 KB
-
 Candle marubozu black.svg 124 × 821; 630 bytes
-
 Candle marubozu white.svg 124 × 821; 630 bytes
-
 Candle spinning black.svg 115 × 824; 1 KB
-
 Candle spinning white.svg 123 × 824; 2 KB
-
 Candle uppershadow.svg 125 × 830; 1 KB
-
 Candle white closing marubozu.png 100 × 542; 2 KB
-
 Candle white closing marubozu.svg 100 × 541; 1 KB
-
 Candle white opening marubozu.png 100 × 542; 2 KB
-
 Candle white opening marubozu.svg 100 × 541; 1 KB
-
 Candle white shortday.svg 130 × 821; 2 KB
-
 Candle white.svg 124 × 821; 1 KB
-
 Candlestick chart (black and white).PNG 320 × 240; 8 KB
-
 Candlestick chart EURUSD October 2009.PNG 407 × 571; 16 KB
-
 Candlestick chart scheme 02-en.svg 1,100 × 500; 142 KB
-
 Candlestick Chart.png 447 × 226; 3 KB
-
 Candlestick pattern bearish abandoned baby.jpg 3,783 × 6,130; 117 KB
-
 Candlestick pattern bearish abandoned baby.svg 344 × 555; 2 KB
-
 Candlestick pattern bearish advance block.jpg 3,685 × 5,669; 120 KB
-
 Candlestick pattern bearish advance block.svg 322 × 561; 3 KB
-
 Candlestick pattern bearish Bearish Kicking.jpg 3,186 × 5,312; 92 KB
-
 Candlestick pattern bearish Bearish Kicking.svg 279 × 472; 2 KB
-
 Candlestick pattern bearish belt hold.jpg 2,000 × 4,888; 196 KB
-
 Candlestick pattern bearish belt hold.svg 200 × 473; 1 KB
-
 Candlestick pattern bearish breakaway.jpg 4,942 × 6,803; 156 KB
-
 Candlestick pattern bearish breakaway.svg 463 × 654; 4 KB
-
 Candlestick pattern bearish dark cloud cover.jpg 3,055 × 5,963; 102 KB
-
 Candlestick pattern bearish dark cloud cover.svg 276 × 545; 2 KB
-
 Candlestick pattern bearish deliberation.jpg 4,024 × 6,520; 137 KB
-
 Candlestick pattern bearish deliberation.svg 347 × 639; 2 KB
-
 Candlestick pattern bearish Downside Gap Three Methods.jpg 3,681 × 6,237; 448 KB
-
 Candlestick pattern bearish Downside Gap Three Methods.svg 350 × 610; 2 KB
-
 Candlestick pattern bearish Downside Tasuki Gap.jpg 3,681 × 6,237; 442 KB
-
 Candlestick pattern bearish Downside Tasuki Gap.svg 350 × 610; 2 KB
-
 Candlestick pattern bearish dragonfly.jpg 2,000 × 6,112; 237 KB
-
 Candlestick pattern bearish dragonfly.svg 200 × 567; 1 KB
-
 Candlestick pattern bearish engulfing.jpg 3,118 × 4,888; 304 KB
-
 Candlestick pattern bearish engulfing.svg 382 × 599; 3 KB
-
 Candlestick pattern bearish Evening Doji Star.jpg 3,783 × 6,130; 117 KB
-
 Candlestick pattern bearish Evening Doji Star.svg 346 × 528; 2 KB
-
 Candlestick pattern bearish Evening Star.jpg 3,783 × 6,130; 119 KB
-
 Candlestick pattern bearish Evening Star.svg 346 × 559; 3 KB
-
 Candlestick pattern bearish Falling Three Methods.jpg 5,060 × 5,706; 551 KB
-
 Candlestick pattern bearish Falling Three Methods.svg 492 × 532; 3 KB
-
 Candlestick pattern bearish harami cross.jpg 3,685 × 6,112; 107 KB
-
 Candlestick pattern bearish harami cross.svg 266 × 508; 2 KB
-
 Candlestick pattern bearish harami.jpg 3,118 × 4,888; 303 KB
-
 Candlestick pattern bearish harami.svg 248 × 477; 2 KB
-
 Candlestick pattern bearish in neck.jpg 2,799 × 5,784; 315 KB
-
 Candlestick pattern bearish in neck.svg 273 × 567; 2 KB
-
 Candlestick pattern bearish meeting lines.jpg 3,118 × 6,492; 104 KB
-
 Candlestick pattern bearish meeting lines.svg 253 × 631; 2 KB
-
 Candlestick pattern bearish on necj.jpg 2,799 × 5,784; 313 KB
-
 Candlestick pattern bearish on necj.svg 273 × 567; 2 KB
-
 Candlestick pattern bearish separating lines.gif 800 × 1,653; 12 KB
-
 Candlestick pattern bearish separating lines.jpg 2,799 × 5,784; 313 KB
-
 Candlestick pattern bearish separating lines.png 800 × 1,653; 4 KB
-
 Candlestick pattern bearish separating lines.svg 273 × 567; 2 KB
-
 Candlestick pattern bearish side-by-side white lines.jpg 3,681 × 6,521; 463 KB
-
 Candlestick pattern bearish side-by-side white lines.svg 339 × 651; 2 KB
-
 Candlestick pattern bearish three black crows.jpg 3,951 × 5,912; 120 KB
-
 Candlestick pattern bearish three black crows.svg 351 × 540; 2 KB
-
 Candlestick pattern bearish three inside down.jpg 3,654 × 4,888; 357 KB
-
 Candlestick pattern bearish three inside down.svg 312 × 477; 2 KB
-
 Candlestick pattern bearish three line strike.jpg 4,292 × 5,784; 499 KB
-
 Candlestick pattern bearish three line strike.svg 403 × 539; 2 KB
-
 Candlestick pattern bearish three outside down.jpg 3,872 × 4,888; 375 KB
-
 Candlestick pattern bearish three outside down.svg 339 × 480; 2 KB
-
 Candlestick pattern bearish tristar.jpg 3,374 × 4,398; 74 KB
-
 Candlestick pattern bearish tristar.svg 276 × 407; 2 KB
-
 Candlestick pattern bearish Upside Gap Two Crows.jpg 3,632 × 6,938; 121 KB
-
 Candlestick pattern bearish Upside Gap Two Crows.svg 333 × 665; 2 KB
-
 Candlestick pattern bullish abandoned baby.jpg 3,783 × 6,130; 119 KB
-
 Candlestick pattern bullish abandoned baby.svg 344 × 555; 2 KB
-
 Candlestick pattern bullish belt hold.jpg 3,186 × 5,312; 322 KB
-
 Candlestick pattern bullish belt hold.svg 202 × 470; 1 KB
-
 Candlestick pattern bullish breakaway.jpg 4,942 × 6,803; 159 KB
-
 Candlestick pattern bullish breakaway.svg 463 × 654; 3 KB
-
 Candlestick pattern bullish concealling baby swallow.jpg 7,087 × 5,312; 158 KB
-
 Candlestick pattern bullish concealling baby swallow.svg 430 × 477; 1 KB
-
 Candlestick pattern bullish Doji Star.jpg 3,118 × 5,669; 90 KB
-
 Candlestick pattern bullish Doji Star.svg 251 × 534; 2 KB
-
 Candlestick pattern bullish engulfing.jpg 3,186 × 5,312; 341 KB
-
 Candlestick pattern bullish engulfing.svg 267 × 465; 2 KB
-
 Candlestick pattern bullish gravestone.jpg 2,000 × 3,992; 173 KB
-
 Candlestick pattern bullish gravestone.svg 200 × 292; 2 KB
-
 Candlestick pattern bullish harami cross.jpg 3,685 × 6,112; 105 KB
-
 Candlestick pattern bullish harami cross.svg 266 × 508; 2 KB
-
 Candlestick pattern bullish harami.jpg 3,118 × 4,888; 302 KB
-
 Candlestick pattern bullish harami.svg 248 × 477; 2 KB
-
 Candlestick pattern bullish homing pigeon.jpg 3,118 × 4,888; 298 KB
-
 Candlestick pattern bullish homing pigeon.svg 248 × 477; 1 KB
-
 Candlestick pattern bullish inverted hammer.jpg 3,186 × 5,312; 332 KB
-
 Candlestick pattern bullish inverted hammer.svg 262 × 442; 2 KB
-
 Candlestick pattern bullish Kicking.jpg 3,186 × 5,312; 95 KB
-
 Candlestick pattern bullish Kicking.svg 279 × 472; 2 KB
-
 Candlestick pattern bullish ladder bottom.svg 428 × 423; 2 KB
-
 Candlestick pattern bullish Mat Hold.jpg 5,228 × 6,521; 635 KB
-
 Candlestick pattern bullish Mat Hold.svg 523 × 652; 3 KB
-
 Candlestick pattern bullish matching low.jpg 3,262 × 4,892; 304 KB
-
 Candlestick pattern bullish matching low.svg 276 × 360; 2 KB
-
 Candlestick pattern bullish meeting lines.jpg 3,118 × 6,492; 107 KB
-
 Candlestick pattern bullish meeting lines.svg 253 × 631; 2 KB
-
 Candlestick pattern bullish Moring Star.jpg 3,783 × 6,130; 121 KB
-
 Candlestick pattern bullish Moring Star.svg 346 × 559; 3 KB
-
 Candlestick pattern bullish Morning Doji Star.jpg 3,783 × 6,130; 118 KB
-
 Candlestick pattern bullish Morning Doji Star.svg 346 × 528; 2 KB
-
 Candlestick pattern bullish penentrating lines.jpg 3,055 × 5,963; 105 KB
-
 Candlestick pattern bullish penentrating lines.svg 276 × 545; 2 KB
-
 Candlestick pattern bullish Rising Three Methods.jpg 5,060 × 5,706; 555 KB
-
 Candlestick pattern bullish Rising Three Methods.svg 492 × 532; 3 KB
-
 Candlestick pattern bullish separating lines.jpg 2,799 × 5,784; 314 KB
-
 Candlestick pattern bullish separating lines.png 800 × 1,653; 4 KB
-
 Candlestick pattern bullish separating lines.svg 273 × 567; 2 KB
-
 Candlestick pattern bullish side-by-side white lines.jpg 3,681 × 6,521; 467 KB
-
 Candlestick pattern bullish side-by-side white lines.svg 339 × 651; 2 KB
-
 Candlestick pattern bullish Stick Sandwich.jpg 3,683 × 4,569; 333 KB
-
 Candlestick pattern bullish Stick Sandwich.svg 325 × 346; 2 KB
-
 Candlestick pattern bullish three inside up.jpg 3,654 × 4,888; 359 KB
-
 Candlestick pattern bullish three inside up.svg 312 × 477; 2 KB
-
 Candlestick pattern bullish three line strike.jpg 4,292 × 5,784; 497 KB
-
 Candlestick pattern bullish Three Line Strike.png 1,227 × 1,653; 6 KB
-
 Candlestick pattern bullish three line strike.svg 403 × 539; 3 KB
-
 Candlestick pattern bullish three outside up.jpg 3,872 × 4,888; 380 KB
-
 Candlestick pattern bullish three outside up.svg 339 × 480; 2 KB
-
 Candlestick pattern bullish Three Star in the South.jpg 3,874 × 5,312; 387 KB
-
 Candlestick pattern bullish Three Star in the South.svg 346 × 453; 1 KB
-
 Candlestick pattern bullish three white soldiers.jpg 3,951 × 5,912; 128 KB
-
 Candlestick pattern bullish three white soldiers.svg 351 × 540; 2 KB
-
 Candlestick pattern bullish thursting.jpg 3,055 × 5,963; 99 KB
-
 Candlestick pattern bullish thursting.svg 276 × 510; 2 KB
-
 Candlestick pattern bullish tristar.jpg 3,374 × 4,398; 75 KB
-
 Candlestick pattern bullish tristar.svg 276 × 407; 2 KB
-
 Candlestick pattern bullish unique Three River Bottom.jpg 3,874 × 5,312; 388 KB
-
 Candlestick pattern bullish unique Three River Bottom.svg 350 × 423; 2 KB
-
 Candlestick pattern bullish Upside Gap Three Methods.jpg 3,681 × 6,237; 446 KB
-
 Candlestick pattern bullish Upside Gap Three Methods.svg 350 × 610; 2 KB
-
 Candlestick pattern bullish upside tasuki gap.jpg 3,681 × 6,237; 443 KB
-
 Candlestick pattern bullish upside tasuki gap.svg 350 × 610; 2 KB
-
 Candlestick pattern Doji Star.jpg 3,118 × 5,669; 92 KB
-
 Candlestick pattern Doji Star.svg 251 × 534; 2 KB
-
 Candlestick pattern gravestone.jpg 2,000 × 6,112; 245 KB
-
 Candlestick pattern gravestone.svg 199 × 603; 2 KB
-
 Candlestick pattern hammer.svg 498 × 1,522; 2 KB
-
 Candlestick pattern hangingman.jpg 2,000 × 6,112; 237 KB
-
 Candlestick pattern hangingman.svg 200 × 606; 2 KB
-
 Candlestick pattern Shooting Star.jpg 2,000 × 5,888; 239 KB
-
 Candlestick pattern Shooting Star.svg 200 × 582; 3 KB
-
 Candlestick pattern two crows.jpg 3,685 × 6,112; 114 KB

.png)


.PNG)


