Category:Ecological diagrams
Jump to navigation
Jump to search
Wikimedia category | |||||
| Upload media | |||||
| Instance of | |||||
|---|---|---|---|---|---|
| |||||
Subcategories
This category has the following 10 subcategories, out of 10 total.
B
E
- Ecogram (12 F)
- Ecological charts (19 F)
- Ecological pyramid (37 F)
- Energy Systems Language (3 F)
- Diagrams of eutrophication (19 F)
F
O
S
Media in category "Ecological diagrams"
The following 157 files are in this category, out of 157 total.
-
 Worldecozones.pt.jpg 961 × 498; 54 KB
-
 Worldecozonesi.pt.jpg 961 × 498; 54 KB
-
 20121224zoogeographicalmap.jpg 4,732 × 1,835; 1.02 MB
-
 A generic ecological pyramid ml.svg 598 × 451; 8 KB
-
 Abb. 13 Streu Humusabbau.tif 1,784 × 1,248; 488 KB
-
 Abb. 4 Ökologische Mykorrhiza-Module.tif 3,346 × 2,574; 1.09 MB
-
 Abiotic Factors.tif 1,920 × 1,219; 951 KB
-
 Abiotische-faktor-temperatur.PNG 1,049 × 640; 53 KB
-
 AP Biology - Primary Succession Drawing.svg 512 × 234; 103 KB
-
 Artenzahlen einer Wiese.png 793 × 711; 28 KB
-
 Atmospheric radiation to human-en.svg 964 × 391; 47 KB
-
 Atmospheric radiation to human-es.png 964 × 391; 43 KB
-
 Atmospheric radiation to human-ko.svg 964 × 391; 40 KB
-
 Atmospheric radiation to human-mr.svg 964 × 391; 34 KB
-
 Atmospheric radiation to human-pa.svg 964 × 391; 33 KB
-
 Atmospheric radiation to human-te.svg 964 × 391; 33 KB
-
 Atmospheric radiation to human.jpg 961 × 424; 36 KB
-
 Atmospheric Transmission de.png 850 × 860; 73 KB
-
 Atmospheric Transmission-ar.png 850 × 857; 138 KB
-
 Atmospheric Transmission-en.svg 741 × 724; 146 KB
-
 Atmospheric Transmission-ko.svg 741 × 724; 160 KB
-
 Atmospheric Transmission-ru.svg 741 × 724; 155 KB
-
 Atmospheric Transmission.png 850 × 857; 75 KB
-
 Atmospheric Transmission.svg 741 × 724; 321 KB
-
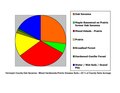
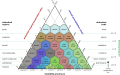
 Biodiversity Pyramid (English).png 690 × 599; 376 KB
-
 Biompyramide.jpg 1,260 × 929; 711 KB
-
 Biosphere-in-kol.jpg 422 × 459; 31 KB
-
 Biotop (Lebensraum).jpg 3,210 × 1,814; 516 KB
-
 Biozönose.jpg 3,507 × 2,550; 601 KB
-
 Bound-1.jpg 1,458 × 1,024; 157 KB
-
 Bronfenbrenner's Ecological Theory of Development (English).jpg 507 × 482; 30 KB
-
 Bronfenbrenner's Ecological Theory of Development.jpg 507 × 482; 39 KB
-
 Carbone flux2.png 1,157 × 1,400; 89 KB
-
 CarryingCapacity 1.jpg 712 × 493; 25 KB
-
 CarryingCapacity 2.jpg 678 × 492; 24 KB
-
 CarryingCapacity 3.jpg 713 × 520; 80 KB
-
 Cellular automata models.jpg 1,883 × 1,168; 507 KB
-
 Chameleon spectra.jpg 4,102 × 2,101; 965 KB
-
 City of Edina Vegetation Wiki Version.pdf 1,275 × 1,650, 3 pages; 654 KB
-
 Clibeticas.png 377 × 330; 2 KB
-
 Clicanarias.png 316 × 330; 2 KB
-
 Clicantabirca.png 262 × 330; 2 KB
-
 Clicentral.png 272 × 330; 2 KB
-
 Cliinverso.png 272 × 330; 2 KB
-
 Clim-infl.svg 740 × 705; 24 KB
-
 Climate influence on terrestrial biome no.svg 716 × 696; 31 KB
-
 Climate influence on terrestrial biome.svg 716 × 696; 18 KB
-
 Clipirineo.png 276 × 330; 2 KB
-
 Competition Gaue1934.png 1,106 × 778; 106 KB
-
 Competition Gause1934.svg 1,100 × 770; 90 KB
-
 Competition-Scenario 1.jpg 720 × 540; 18 KB
-
 Competition-Scenario 2.jpg 720 × 540; 19 KB
-
 Competition-Scenario 3.jpg 720 × 540; 19 KB
-
 Competition-Scenario 4.jpg 720 × 540; 19 KB
-
 Distribution of tyre wear and tear.png 2,753 × 2,015; 1.36 MB
-
 Douglas Co Native Vegetation Pie Chart Wiki Version.pdf 1,650 × 1,275; 32 KB
-
 Dynamique de population proie-prédateur.jpg 562 × 366; 59 KB
-
 DérangementDisturbing.png 3,037 × 5,184; 610 KB
-
 Ecoecolfigure3.jpg 1,281 × 854; 85 KB
-
 Ecological Footprint Graph with Five Major Events.png 2,246 × 1,408; 220 KB
-
 Ecological pyramid hi.png 432 × 268; 13 KB
-
 Ecological pyramid-hi.svg 598 × 451; 7 KB
-
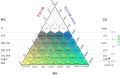
 Ecological Pyramid.png 1,000 × 718; 161 KB
-
 Ecological Pyramid.svg 512 × 368; 180 KB
-
 EcologicalFootprintGraph To2007 NoDoubt.png 2,246 × 1,408; 206 KB
-
 Elements-of-biodiversity.png 3,459 × 3,004; 6.54 MB
-
 Environmental impact of aquatic photosynthetic microorganisms.png 2,540 × 1,794; 1.15 MB
-
 Equilibrio energetico.jpg 372 × 364; 54 KB
-
 Esquema de desastre.JPG 660 × 494; 60 KB
-
 Etapesbiogas.jpg 567 × 275; 28 KB
-
 Ewolucja nisz.svg 1,414 × 763; 29 KB
-
 Exponential growth.svg 575 × 272; 92 KB
-
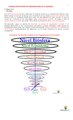
 Extinction Vortex Korean.png 1,050 × 846; 137 KB
-
 Fillmore Co pie chart Wiki Version.pdf 1,650 × 1,275; 32 KB
-

-
 Generisk økologisk amplitude.png 599 × 334; 60 KB
-
 Glacial Lakes State Park Native Vegetation Wiki Version.pdf 1,275 × 1,650, 2 pages; 423 KB
-

-
 Graslandtypen oekogramm.png 701 × 657; 70 KB
-
 Halogene Chemistry in the Atmosphere.png 2,062 × 771; 317 KB
-
 Head Lake WMA neighborhood Wiki Version.pdf 1,275 × 1,650; 197 KB
-
 Hennepin co pie chart and soils info Wiki Version.pdf 1,650 × 1,275, 4 pages; 194 KB
-
-
 Intermediate Disturbance Hypothesis Graph.svg 512 × 384; 21 KB
-

-
 Klimazonen-Niederschlagsbereiche-Makroklimate (1961–1990).png 703 × 879; 186 KB
-
 Krzywe logistyczne.png 706 × 279; 5 KB
-
 Life-Zones (de).png 2,560 × 1,590; 894 KB
-
 Lifezones Pengo, by ecology.svg 911 × 569; 186 KB
-
 Lifezones Pengo, by type.svg 911 × 569; 140 KB
-
 Lifezones Pengo, FAO.svg 988 × 615; 136 KB
-
 Lifezones Pengo, IRI.svg 988 × 613; 144 KB
-
 Lifezones Pengo, TSMF.svg 986 × 613; 198 KB
-
 Lifezones Pengo-KO.svg 987 × 613; 108 KB
-
 Lifezones Pengo.svg 987 × 613; 264 KB
-
 Lineair Unimodaal.PNG 732 × 290; 10 KB
-
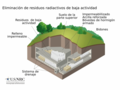 Low Level Waste Disposal (44021366302)-es.png 1,080 × 810; 312 KB
-
 Low Level Waste Disposal (44021366302).jpg 1,080 × 810; 108 KB
-
 M-H model.png 425 × 251; 5 KB
-
 Maas-Hoffman model.png 425 × 251; 6 KB
-
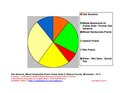
 Marshall County Pie Chart Wiki Version.pdf 1,650 × 1,275; 33 KB
-
 Medida.png 528 × 545; 41 KB
-
 Metoda CMR.svg 1,995 × 707; 200 KB
-
 Microecosystem.jpg 1,331 × 731; 249 KB
-

-
 ModelLevinsa.svg 716 × 588; 127 KB
-
 Monson Lake State Park Ecosystems Wiki Version.pdf 1,650 × 1,275, 3 pages; 637 KB
-
 MSY models.jpg 576 × 408; 63 KB
-
 Nisza XYZ.svg 1,149 × 877; 38 KB
-
 Nisza.pokarm.svg 1,296 × 749; 1.31 MB
-
 Nisze Dendroica tigrinai i Dendroica castanea.svg 4,721 × 2,251; 5.04 MB
-
 NiveauOrganisationIntégrationBiodiversité.jpg 584 × 1,024; 215 KB
-
 NiveauOrganisationIntégrationVivant.jpg 1,094 × 1,024; 244 KB
-
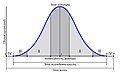
 Normal-sigma.png 1,647 × 894; 49 KB
-
 Oekogram-da-cropped.png 756 × 766; 129 KB
-
 Oekogram-da.png 1,152 × 767; 160 KB
-
 Olmsted Co Pie Chart Wiki Version.pdf 1,650 × 1,275; 41 KB
-
 Organization levels mouse.svg 1,435 × 1,085; 112 KB
-
 Oscylacje.png 3,380 × 498; 17 KB
-
-
 Pie densité.jpg 938 × 768; 117 KB
-
 Pie tendance stoc.jpg 785 × 728; 76 KB
-
 PieHabitatStoc.jpg 914 × 1,613; 141 KB
-
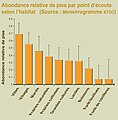 Pies abondance STOC modifié-1.jpg 1,011 × 1,027; 103 KB
-
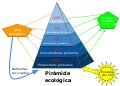 Piramide ecológica.svg 512 × 368; 44 KB
-

-
 Pojemnosc.srodowiska.svg 655 × 560; 109 KB
-
 Population distribution.svg 313 × 655; 51 KB
-
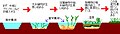
 Primary Succession.svg 512 × 207; 556 KB
-
 Primærproduksjon i forskjellige biomer.svg 514 × 319; 15 KB
-
 Pristimantis richness area relationship.jpg 1,512 × 1,154; 189 KB
-
 Pristimantis richness by biogeographic region.jpg 1,317 × 2,197; 796 KB
-
 Red Lake Co pie chart Wiki Version.pdf 1,650 × 1,275; 32 KB
-
 Red Queen hypothesis in predator-prey model.png 1,280 × 720; 44 KB
-
 S-curve model.png 412 × 291; 5 KB
-
 Silver Spring Model.jpg 656 × 522; 81 KB
-
 Socio-Ecological Model.png 470 × 737; 74 KB
-

-
 Spiral de los niveles de evolución organizacional de los sistemas materiales.pdf 1,275 × 2,100, 4 pages; 190 KB
-
 St Louis Park Native Vegetation Wiki Version.pdf 1,275 × 1,650, 3 pages; 583 KB
-
 Strukt.eko.svg 724 × 768; 98 KB
-
 Temperatur.JPG 1,011 × 600; 33 KB
-
 The macroevolutionary Red Queen.png 400 × 371; 9 KB
-
 Tolerance Model of Ecological Succession.JPG 643 × 388; 17 KB
-
 Tolerancja ekologiczna+.svg 451 × 152; 12 KB
-
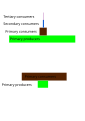 Trophic Levels.svg 744 × 1,052; 7 KB
-
 Typ geobiocenu.svg 940 × 431; 89 KB
-
 Van Genugten-Gupta model.png 406 × 289; 6 KB
-
 Wadena County Pie Chart Wiki Version.pdf 1,650 × 1,275; 33 KB
-
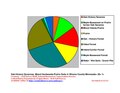
 Waseca County Minnesota Native Vegetation Pie Chart Wiki Version.pdf 1,650 × 1,275; 32 KB
-
 Winona County Pie Chart Wiki Version.pdf 1,650 × 1,275; 32 KB
-
 Zugvögel in Mitteleuropa.jpg 704 × 294; 147 KB
-
 Ökologie.jpg 3,508 × 2,480; 1.01 MB
-
 КЖДМР.jpg 1,622 × 998; 112 KB
-
 תרשים מודל האי.png 389 × 317; 18 KB
-
 植生遷移図.JPG 700 × 200; 30 KB
-
 湿性遷移図.JPG 700 × 200; 31 KB


.png)


.jpg)


.jpg)


.png)


.png)
.png)
.png)


-es.png)
.jpg)


.png)


