Category:World statistics
Jump to navigation
Jump to search
| NO WIKIDATA ID FOUND! Search for World statistics on Wikidata | |
| Upload media |
Subcategories
This category has the following 22 subcategories, out of 22 total.
A
C
- Contemporary witchcraft beliefs (11 F)
D
- Global DALY statistics (33 F)
E
F
- World food statistics (52 F)
G
K
- Keeling Curves (64 F)
L
- Life on Earth by weight (13 F)
P
S
T
W
Media in category "World statistics"
The following 200 files are in this category, out of 300 total.
(previous page) (next page)-

-
 2014 Distribution of Languages on Internet Websites.jpg 1,000 × 625; 189 KB
-
 20191231 Vital signs of the planet - NASA - climate change.png 1,350 × 100; 36 KB
-
-
 20211231 Vital signs of the planet - NASA - climate change.png 3,700 × 275; 43 KB
-
 2022 Counting the cost of disasters - climate change - Christian Aid.svg 1,600 × 900; 2 KB
-
 8000 BCE+ Loss of forest and grassland to grazing and crops.svg 1,200 × 675; 3 KB
-
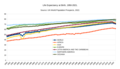
 Adoption of communication technologies, World.png 3,400 × 2,400; 506 KB
-
 Air-pollution-deaths-by-age (OWID 0074).png 850 × 600; 59 KB
-
 Annual number of deaths by world region, OWID.svg 850 × 600; 20 KB
-
 Annual total CO₂ emissions, by world region.png 3,400 × 2,400; 531 KB
-

-
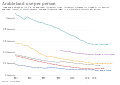 Arable land use per person, OWID.svg 850 × 600; 21 KB
-
 Arable-land-pin (OWID 0090).png 850 × 600; 57 KB
-
 Article par million d'habitants.jpg 2,048 × 686; 82 KB
-
 Articles en fonction dépenses.png 1,123 × 794; 41 KB
-
-
 Barley production and consumption in Spain, UE and worldwide (1961-2003).JPG 1,751 × 1,602; 288 KB
-
 Biophysical Effects on Global Temperature From Deforestation by 10° Latitude Band.jpg 4,223 × 3,795; 640 KB
-
 BK 2016 GHI ch02 fig01.png 1,061 × 562; 37 KB
-
 Breakdown of child mortality by cause, OWID.svg 850 × 600; 9 KB
-
 Broadband subscriptions per 100 people, OWID.svg 850 × 600; 11 KB
-
 Cancer deaths by type, 1, OWID.svg 850 × 600; 19 KB
-
 Cancer-deaths-by-type.png 3,400 × 2,400; 742 KB
-
 Capture-and-aquaculture-production (OWID 0132).png 850 × 600; 60 KB
-
 Capture-fisheries-vs-aquaculture (OWID 0131).png 850 × 600; 67 KB
-
 Carbon dioxide (CO₂) emissions by sector or source, OWID.svg 850 × 600; 17 KB
-
 Cardiovascular disease death rates by age, OWID.svg 850 × 600; 17 KB
-
 Causes of death in children under 5, OWID.svg 850 × 600; 18 KB
-
 Causes of death in under-5s, OWID.svg 850 × 600; 18 KB
-
 Causes of deaths for 15 to 49 year olds, OWID.svg 850 × 600; 18 KB
-
 Causes of deaths for 50 to 69 year olds, OWID.svg 850 × 600; 17 KB
-
 Causes of deaths for children between 5 and 14, OWID.svg 850 × 600; 16 KB
-
 Causes of deaths for people who were 70 years and older, OWID.svg 850 × 600; 18 KB
-
 Change in global daily fossil CO₂ emissions, % during the COVID-19 pandemic.jpg 4,096 × 2,816; 302 KB
-
 Child deaths in the 1st year of life, OWID.svg 850 × 600; 8 KB
-
 Child-deaths-from-rotavirus.png 3,400 × 2,400; 447 KB
-
 Childhood-deaths-from-the-five-most-lethal-infectious-diseases-worldwide.png 3,400 × 2,400; 430 KB
-
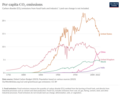 CO2-emissions-per-capita.png 3,400 × 2,706; 767 KB
-
 Co2-long-term-concentration.png 3,400 × 2,400; 655 KB
-
-
-
 Coral-bleaching-events (OWID 0244).png 850 × 600; 60 KB
-
 Cumulated CO2 Emissions.jpg 1,554 × 1,182; 897 KB
-
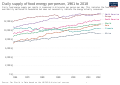 Daily per-capita food energy supply of regions.svg 850 × 600; 68 KB
-
 Daily-smoking-prevalence.png 3,400 × 2,400; 479 KB
-
 Damage-costs-from-natural-disasters.png 3,400 × 2,400; 366 KB
-
 Death rate by cause, OWID.svg 850 × 600; 8 KB
-
 Death rates by broad cause category, OWID.svg 850 × 600; 15 KB
-
 Death rates from natural disasters, OWID.svg 850 × 600; 13 KB
-
 Death-rates-natural-disasters (OWID 0308).png 850 × 600; 62 KB
-
 Deaths by age, OWID.svg 850 × 600; 11 KB
-
 Deaths from cardiovascular diseases, by age, OWID.svg 850 × 600; 12 KB
-
 Deaths from protein-energy malnutrition, by age, OWID.svg 850 × 600; 12 KB
-
 Deaths from road incidents, by age, OWID.svg 850 × 600; 11 KB
-
 Deaths from substance use disorders by age, OWID.svg 850 × 600; 12 KB
-
 Deaths from suicide, by age, OWID.svg 850 × 600; 9 KB
-
 Deaths from tobacco, alcohol and drugs, OWID.svg 850 × 600; 7 KB
-
 Deaths from tuberculosis, by age, OWID.svg 850 × 600; 11 KB
-
 Deaths in armed conflicts by type from 1990 to 2002.png 3,400 × 2,944; 622 KB
-
 Deaths in armed conflicts by type from 2001 to 2022.png 3,400 × 2,944; 625 KB
-
 Deaths in armed conflicts by type from 2003 to 2022.png 3,400 × 2,944; 626 KB
-
 Deaths-from-air-pollution (OWID 0303).png 850 × 600; 48 KB
-
 Deaths-from-cardiovascular-disease-type.png 3,400 × 4,742; 1.42 MB
-
 Deaths-from-indoor-air-pollution-by-age (OWID 0298).png 850 × 600; 52 KB
-
 Deaths-from-natural-disasters-by-type (OWID 0299).png 850 × 600; 64 KB
-
 Deaths-risk-factor-15-49years.png 3,400 × 2,400; 531 KB
-
 Deaths-risk-factor-5-14years.png 3,400 × 2,400; 398 KB
-
 Drinking water service coverage, OWID.svg 850 × 600; 9 KB
-
 Drinking water services coverage in rural areas, OWID.svg 850 × 600; 8 KB
-
 Drinking water services coverage in urban areas, OWID.svg 850 × 600; 10 KB
-
 Earthquake-deaths.png 3,400 × 2,400; 621 KB
-
 Economic-damage-from-natural-disasters (OWID 0272).png 850 × 600; 70 KB
-
 Economic-losses-from-disasters-share-gdp.png 3,400 × 2,400; 756 KB
-
 Effects of COVID-19 on global CO2 emissions.webp 1,590 × 2,524; 161 KB
-
 Electricity generation by source, OWID.svg 850 × 600; 6 KB
-
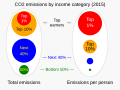
 Emissions-by-sector-–-pie-charts.png 1,302 × 1,233; 265 KB
-
 Employed-fisheries-aquaculture (OWID 0368).png 850 × 600; 49 KB
-
 Employed-fisheries-aquaculture-time (OWID 0369).png 850 × 600; 42 KB
-
 Energy consumption by source, OWID.svg 850 × 600; 47 KB
-
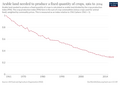
 Estadística de la producció dels principals cereals (món).png 839 × 305; 50 KB
-
 Estadística de la superfície cultivada de cereals al món.png 837 × 293; 33 KB
-

-
 Estadística dels rendiments dels principals cereals al món.png 839 × 302; 48 KB
-
 Evolució de la producció i del consum de Cereals al món.png 841 × 239; 34 KB
-
 Excess-deaths-cumulative-economist-single-entity (1).png 3,400 × 2,400; 495 KB
-
 Fire death rates by age, OWID.svg 850 × 600; 17 KB
-
 Fish-and-seafood-consumption-per-capita-historical.svg 850 × 600; 69 KB
-
 Fish-discards-gear (OWID 0435).png 850 × 600; 55 KB
-
 Fish-landings-and-discards (OWID 0434).png 850 × 600; 63 KB
-
 Food-, land-, and climate change mitigation-gaps for 2050.jpg 2,813 × 719; 329 KB
-
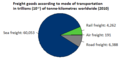 Freight goods according to mode of transportation 2010.png 468 × 235; 9 KB
-
 Global aging demographics.webp 1,946 × 894; 96 KB
-
 Global capture fishery production, OWID.svg 850 × 600; 7 KB
-
 Global carbon budget components.png 2,067 × 2,597; 341 KB
-
 Global Carbon Budget Results - Fossil CO2 emissions charts.png 2,067 × 1,737; 186 KB
-
 Global daily CO2 emissions for sectors.webp 1,717 × 1,591; 221 KB
-
 Global damage costs from natural disasters, OWID.svg 850 × 600; 10 KB
-
 Global deaths from natural disasters, OWID.svg 850 × 600; 11 KB
-
 Global distribution of aviation fuel use.jpg 2,389 × 1,199; 133 KB
-
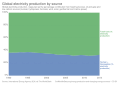 Global electricity production by source, OWID.svg 850 × 600; 7 KB
-
 Global energy consumption by source (substitution method), OWID.svg 850 × 600; 46 KB
-
 Global Energy Consumption.svg 960 × 791; 43 KB
-
 Global freshwater use over the long-run, OWID.svg 850 × 600; 8 KB
-
 Global GHG Emissions by Sector 2016.png 1,740 × 1,305; 231 KB
-
 Global hydroelectric power consumption, terawatt-hours, OWID.svg 850 × 600; 8 KB
-

-
 Global Methane Budget 2017.jpg 1,725 × 1,036; 515 KB
-
 Global Nitrous Oxide Budget 2020.png 1,699 × 1,111; 193 KB
-
 Global ocean-atmosphere CO2 fluxes 1992–2018.webp 955 × 1,342; 112 KB
-
 Global onshore wind installed project costs, OWID.svg 850 × 600; 10 KB
-
 Global primary energy consumption by source 1900 - 2021.png 3,400 × 2,400; 525 KB
-
 Global primary energy consumption by source.png 1,817 × 845; 104 KB
-
 Global renewable energy consumption, OWID.svg 850 × 600; 16 KB
-
 Global reported natural disasters by type, OWID.svg 850 × 600; 60 KB
-
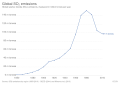 Global SO₂ emissions, OWID.svg 850 × 600; 5 KB
-
 Global weather disaster losses as a share of GDP, OWID.svg 850 × 600; 8 KB
-
 Global-change-over-the-last-50-years (OWID 0467).png 850 × 600; 124 KB
-
 Global-hydro-consumption (OWID 0544).png 850 × 600; 45 KB
-
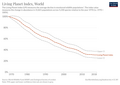 Global-living-planet-index (OWID 0539).png 850 × 600; 65 KB
-
 Global-monthly-temp-anomaly.png 3,400 × 2,400; 857 KB
-
 Globales N2O Budget.png 1,699 × 1,111; 265 KB
-
 Globales N2O Budget.svg 800 × 450; 576 KB
-

-
 Growth of Library Genesis, 2009-2022.png 847 × 587; 41 KB
-
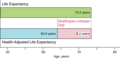 Healthspan-lifespan gap.webp 951 × 468; 29 KB
-
 Healthy life expectancy bar chart -world -sex.png 1,724 × 587; 71 KB
-
 Healthy life expectancy bar chart -world.png 1,724 × 587; 98 KB
-
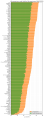 Healthy Life Years and LEB.svg 565 × 1,517; 433 KB
-

-
 Hiv-death-rates-by-age.png 3,400 × 2,400; 317 KB
-
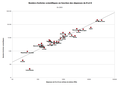
 Human welfare and ecological footprint sustainability-TR.png 850 × 522; 83 KB
-
 Hydropower generation by region, OWID.svg 850 × 600; 21 KB
-
 Infectious-disease-death-rates.jpg 3,400 × 2,400; 93 KB
-
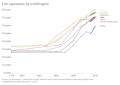
 Internet users by world region, OWID.svg 850 × 600; 12 KB
-
 Kaya-identity-co2.svg 850 × 600; 46 KB
-
 Land-use (OWID 0580).png 850 × 600; 33 KB
-

-
 Life Expectancy at Birth 1950-2021.png 2,656 × 1,537; 342 KB
-
 Life expectancy by world region, from 1770 to 2018.svg 850 × 600; 42 KB
-
 Life expectancy by world region, OWID.svg 850 × 600; 15 KB
-
 Life expectancy in macroregion -world -diff -ru.png 1,153 × 721; 93 KB
-
 Life expectancy in macroregion -world -diff.png 1,153 × 721; 89 KB
-
 Life expectancy in macroregion -world -ru.png 1,162 × 607; 82 KB
-
 Life expectancy in macroregion -world.png 1,162 × 607; 78 KB
-
 Long-term-change-in-land-use.png 3,214 × 2,900; 501 KB
-
 Maize production and consumption in Spain, UE and worldwide (1961-2003).jpg 1,755 × 1,600; 560 KB
-

-
 Material-footprint-per-capita (OWID 0550).png 850 × 600; 37 KB
-
 Measles-vaccine-coverage-worldwide-vs-measles-cases-worldwide.jpg 3,400 × 2,400; 185 KB
-
 Metal production over the long term, OWID.svg 850 × 600; 66 KB
-
 Methane (CH₄) atmospheric concentration, OWID.svg 850 × 600; 9 KB
-
 Methane global emissions from the five broad categories.png 1,213 × 1,620; 35 KB
-
 Millet production and consumption in Spain, EU and worldwide (1961-2003).jpg 1,746 × 1,602; 380 KB
-
 Monkeypox cumulative-deaths linear-plot.svg 850 × 600; 38 KB
-
 Motor vehicle, motorcyclist, cyclist and pedestrian deaths, OWID.svg 850 × 600; 12 KB
-
 Multidrug-resistant-tuberculosis-without-extensive-drug-resistance.png 3,400 × 2,400; 331 KB
-
 N input to croplands in 2015 in the main global regions.webp 2,121 × 1,449; 76 KB
-
 Nitrous oxide (N₂O) atmospheric concentration, OWID.svg 850 × 600; 9 KB
-
 Nitrous oxide emissions by sector, OWID.svg 850 × 600; 18 KB
-
 Nuclear power generation.svg 850 × 600; 30 KB
-
 Number left homeless from natural disasters, OWID.svg 850 × 600; 10 KB
-
 Number of claim revision pairs in each debate category of Kialo.png 1,212 × 1,442; 207 KB
-
 Number of countries where homosexuality is legal, OWID.svg 850 × 600; 15 KB
-
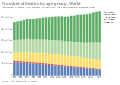 Number of deaths by age group, OWID.svg 850 × 600; 23 KB
-
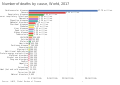 Number of deaths by cause, OWID.svg 850 × 600; 20 KB
-
 Number of deaths by risk factor aged 15-49, OWID.svg 850 × 600; 13 KB
-
 Number of deaths by risk factor aged 5-14, OWID.svg 850 × 600; 10 KB
-
 Number of deaths by risk factor aged 50-69, OWID.svg 850 × 600; 13 KB
-
 Number of deaths by risk factor aged 70+, OWID.svg 850 × 600; 13 KB
-
 Number of deaths by risk factor for under-5s, OWID.svg 850 × 600; 10 KB
-
 Number of deaths by risk factor, OWID.svg 850 × 600; 18 KB
-
 Number of deaths from alcohol and drug use disorders, OWID.svg 850 × 600; 7 KB
-
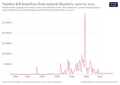
 Number of deaths from earthquakes, OWID.svg 850 × 600; 20 KB
-
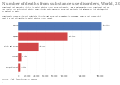 Number of deaths from substance use disorders, OWID.svg 850 × 600; 7 KB
-
 Number of deaths from volcanic eruptions, OWID.svg 850 × 600; 14 KB
-
 Number of people defined as undernourished, OWID.svg 850 × 600; 7 KB
-
 Number of people with alcohol use disorders by region, OWID.svg 850 × 600; 25 KB
-
 Number of people with alcohol use disorders, OWID.svg 850 × 600; 6 KB
-

-

-

-
 Number of people with and without electricity access, OWID.svg 850 × 600; 12 KB
-

-

-
 Number-homeless-from-natural-disasters (OWID 0738).png 850 × 600; 67 KB
-
 Number-of-deaths-from-diarrheal-diseases-by-risk-factor-for-under-5s.png 3,400 × 2,400; 508 KB
-
 Number-of-deaths-from-natural-disasters.png 3,400 × 2,400; 430 KB
-
 Number-of-deaths-from-tuberculosis-by-world-region.png 3,400 × 2,400; 475 KB
-
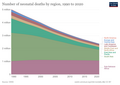 Number-of-neonatal-deaths-by-region.png 3,400 × 2,400; 452 KB
-
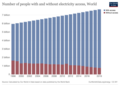 Number-of-people-with-and-without-electricity-access.png 3,400 × 2,400; 477 KB
-
 Number-of-people-with-cancer-by-type.jpg 3,400 × 2,400; 175 KB
-
 Number-of-people-with-cancer-by-type.png 3,400 × 2,400; 483 KB
-
 Number-requiring-treatment-for-ntds-by-region.png 3,400 × 2,400; 415 KB
-
 Number-without-electricity-by-region (OWID 0715).png 850 × 600; 80 KB
-
 Oats production and consumption in Spain, UE and worldwide (1961-2003).JPG 1,753 × 1,600; 260 KB
-
 Pandemics-Timeline-Death-Tolls-OWID 9818.png 9,818 × 13,400; 2.58 MB
-
 Pandemics-Timeline-Death-Tolls-OWID 9818.webp 9,818 × 1,112; 798 KB
-
 People without access to electricity by region, OWID.svg 850 × 600; 15 KB
-
 Per-capita-co2-fuel (OWID 0786).png 850 × 600; 42 KB
.svg)


.png)


,_OWID.svg)

.png)


.JPG)


.png)
.png)
_emissions_by_sector_or_source,_OWID.svg)


.png)


.png)


.png)

.png)
.png)


.png)


.png)
.png)

.png)


.png)
.png)


,_OWID.svg)


.png)
.png)
.png)


.png)


.jpg)
.png)
.png)


_atmospheric_concentration,_OWID.svg)

.jpg)


_atmospheric_concentration,_OWID.svg)


.png)


.png)
.JPG)


.png)
.png)