Category:Information graphics about trade
Jump to navigation
Jump to search
Subcategories
This category has only the following subcategory.
Media in category "Information graphics about trade"
The following 25 files are in this category, out of 25 total.
-

-
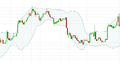 Bollinger Bands.png 1,125 × 591; 45 KB
-
 Cfd-infografica.png 1,204 × 1,180; 199 KB
-
 Datenhandel prisma 1.0.jpg 1,800 × 1,350; 407 KB
-
 Different-Types-of-Trade1.png 749 × 435; 13 KB
-

-
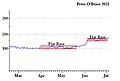 Example of Flat base pattern.jpg 471 × 319; 57 KB
-
 Figure Tête et épaules.png 534 × 390; 13 KB
-
 Flux du prêt de titre.jpg 607 × 259; 19 KB
-
 Futures Trading Composition.jpg 366 × 462; 46 KB
-
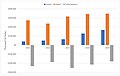 Goods imports and exports between Australia and Norway. OECD.Stat data.jpg 1,597 × 1,005; 86 KB
-
 Handelsbilanzausgleich multilanguage.svg 476 × 323; 24 KB
-
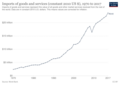 Imports of goods and services (constant 2010 US $), 1970 to 2017.png 3,400 × 2,400; 227 KB
-

-
 JUSTRADER Web Trader.jpg 1,672 × 777; 360 KB
-
 Komparativfordel.JPG 818 × 605; 43 KB
-
 Komparativní výhoda - hranice výrobních možností.png 560 × 560; 27 KB
-
 Lebanon trade 2017.png 2,005 × 1,056; 104 KB
-
 Midpoint Pivots.png 2,445 × 1,236; 191 KB
-
 Optimal Execution Horizon (OEH) of a trading order.jpg 5,697 × 4,138; 766 KB
-
 Support and Resistance.png 1,250 × 1,000; 161 KB
-
 The interrelatedness of the EU market.png 2,000 × 2,000; 1.25 MB
-
 Transformationskurve Produktions- und Konsummöglichkeiten.jpg 1,036 × 659; 58 KB
-
-
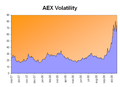 VAEX.PNG 655 × 476; 44 KB


.PNG)


,_1970_to_2017.png)
.jpg)


_of_a_trading_order.jpg)


