Category:Analytical chemistry charts
Jump to navigation
Jump to search
Media in category "Analytical chemistry charts"
The following 32 files are in this category, out of 32 total.
-
 AcidBase–pfe.png 762 × 1,164; 85 KB
-
 Bland-altman plot.png 1,008 × 1,008; 39 KB
-
 Buffer capacity.png 311 × 247; 3 KB
-
 Buffer Capacity.png 509 × 492; 43 KB
-
 Calibration curve.png 2,000 × 1,200; 25 KB
-
 ChromatographieSchematisch.svg 425 × 833; 59 KB
-
 Curve di precipitazione.JPG 452 × 384; 15 KB
-
 Debye-Hckel equation.png 402 × 476; 4 KB
-
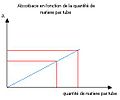 Droite de colorimétrie.jpg 294 × 244; 8 KB
-
 Dynamic equilibrium.png 305 × 249; 2 KB
-
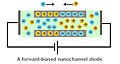 Forward-biased diode.JPG 981 × 523; 52 KB
-
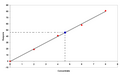 IJklijn.PNG 968 × 602; 16 KB
-
 Ionic Bipolar Transistor.jpg 863 × 425; 34 KB
-
 Long-channel.jpg 1,040 × 534; 68 KB
-
 Microchannel.jpg 908 × 562; 72 KB
-
 Nano-pipet.JPG 974 × 709; 47 KB
-
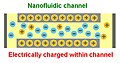 Nanochannel.jpg 914 × 483; 64 KB
-
 Normalization of concentration.png 686 × 307; 35 KB
-
 Peloidprobe.jpg 935 × 718; 240 KB
-
 Photometrie Absorptionsmaximum.svg 892 × 525; 9 KB
-
 Photometrie Kalibrierkurve.svg 915 × 591; 7 KB
-
 PK acetic acid.png 326 × 290; 3 KB
-
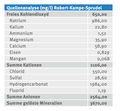 Quellenanalyse Robert-Kampe-Sprudel.png 430 × 399; 72 KB
-
 SchotelhoogteH.jpg 308 × 288; 13 KB
-
 Short-channel.jpg 1,036 × 537; 57 KB
-
 Silver Chloride dissolution.png 242 × 241; 3 KB
-
 StandaardAdditieGrafiek.JPG 685 × 427; 30 KB
-
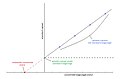 Standaardadditiegrafiek.jpg 744 × 489; 21 KB
-
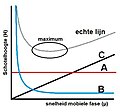
 Verschillendegassenalsmobielefase.jpg 285 × 288; 11 KB
-
 Weak acid speciation2.png 280 × 283; 3 KB
-
 Γ±-coefficient-of-aqueous-HCl.png 1,100 × 753; 97 KB
-
 鏡像体過剰率.png 726 × 800; 26 KB


