Template:3-ary Boolean functions; BEC; nesting analysis; overview

- See also: v:Studies of Euler diagrams/splits
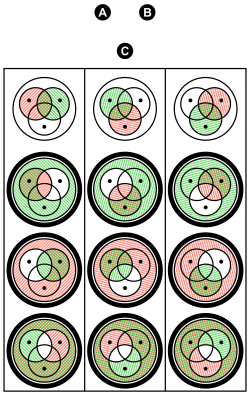
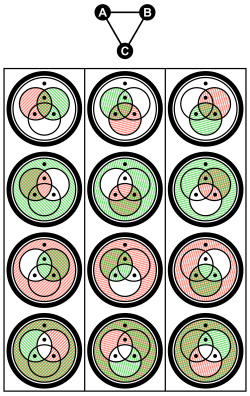
Boolean functions can be represented as Euler diagrams. Some circles in them intersect, and some don't.
The Euler diagram on the right shows a bundle of two intersecting circles in the middle. The circle around it is a bundle on its own.
These images show an algorithmic way to find out which arguments are bundled together, and which are separate.
They can be described in terms of sets, but the concept split is more useful.
That term is used to express, that of the universe is split in two halves in a particular way.
(But without the choice which half is to be considered the set, and which the complement.)
There are three ways how two different splits can relate to each other, and three more where they are equal.
These cases can mostly be distinguished by their number of non-empty intersections. (But there are two different cases with 2.)
In these images that are the red/green overlaps with at least one black dot. Their Venn diagrams are marked with a black ring.
Files for each BEC ordered by pattern:
| 0 |
1 |
|---|---|
| BEC 0 |  BEC 1 |

|

|
| 2 |
3 |
4 |
5 |
|---|---|---|---|
  BEC 2 |
  BEC 3 |
  BEC 4 |
  BEC 5 |

|

|

|

|
| 15, 18, 19 | ||
|---|---|---|
  BEC 15 |
  BEC 18 |
  BEC 19 |

|

|

|
| 7, 13, 16, 20, 21 | ||||
|---|---|---|---|---|
 BEC 7 |
 BEC 13 |
 BEC 16 |
 BEC 20 |
 BEC 21 |

|

|

|

|

|
| 14, 17 | |
|---|---|
  BEC 14 |
  BEC 17 |

|

|
| 6, 11 |
9 |
12 | |
|---|---|---|---|
  BEC 6 |
  BEC 11 |
  BEC 9 |
  BEC 12 |

|

|

|

|
| 8 |
10 |
|---|---|
  BEC 8 |
  BEC 10 |

|

|
| two versions of BEC 9 | |
|---|---|
|
Each of the 22 equivalence classes above is represented by the function shown in the overview file. | |
  1001 0001 |
  0110 0100 |

|

|


