Flow diagram
type of diagram representing a flow or set of dynamic relationships  Flow diagram for the production of Ammonia | |||||
| Upload media | |||||
| Subclass of | |||||
|---|---|---|---|---|---|
| Different from | |||||
| |||||
History[edit]
- Earlier examples
- Tabula Peutingeriana, fourth or early fifth century.
- Category:Portolan charts, since thirteenth century
- 18th century and earlier works
-
 Wanderings in the desert map, 1641
 -
 Gemelli Map of the Aztec Migration from Aztlan to Chapultapec, 1704
 -
 Table of Hydraulics and Hydrostatics, Cyclopaedia, Volume 1, 1728
 -
 An Universal System of Water and Water-Works by Stephen Switzer, 1734
 -
 Tableau économique by Francois Quesnay, 1759
 -
 Engine elevation, a drawing with (small) arrows, 1797


- 19th century
-
 General idea of ground to be drained, 1826
 -
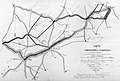 Flow map by Minard, 1845
 -
 Steam-engine for fan to withdrawing air from mines, 1854
 -
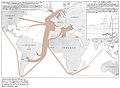
 Émigrants du Globe by Minard, 1858
 -
 Battlefield Of Gettysburg, 1863
 -
 Flow map by Minard, 1864
 -
 Steam engine cylinder side pipes with valves, 1866
 -
 Charles Minard's chart, 1869
 -
 Flow diagram of production process, 1870
 -
 Demand for Commodities is not Demand for Labor by John Stuart Mill, 1885
 -
 Foreign exchange by John Stuart Mill, 1885
 -
 Flow of costs in a factory by Metcalfe, 1885
 -
 Early data flow diagram, 1887/93
 -
 Diagram of Manufacturing Accounts, 1896
 -
 Diagram of Expenditure and Results, showing the relations between departments, 1897.
 -
 Sankey diagram, 1898


- 20th century, first half
-
 Economic production and distribution by Seager, 1904
 -
 Flow diagram of Organization Elements of an Industrial Body, 1905
 -
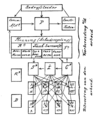
 Systems of advertising, 1906
 -
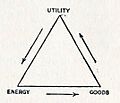 Economic Life triange by Nearing, 1909
 -
 Perspective routing diagram by Charles Day, 1911
 -
 Detail Routing Diagram by Charles Day, 1911
 -
 Graphic Representation of Processes and Routing in a Representative Plant, 1914
 -
 Routing Diagram for Materials and for Printing Forms in a Manufacturing Plant, 1914
 -
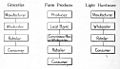 Channels of distribution for various lines of goods by Nystrom, 1915.
 -
 Division of labour according to Taylor, 1916
 -
 Flow Process Chart, 1921/1948/2008
 -
 The Round Flow of Money Income and Expenditure, 1922
 -
 Traffic Flow Diagram, 1929
 -
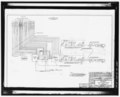
 Flow diagram of steam generation process, 1930
 -
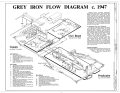 Grey Iron Flow Diagram c. 1947


.png)
.png)
- 20th century, second half
-
 Flow chart showing how interconnecting analog and digital computers , 1956
 -
 Vehicle servicing system flow diagram, 1958
 -
 Booster liquid oxygen system flow diagram, 1958
 -
 The competitive price system adapted from Samuelson, 1961
 -
 Block diagram of central computer and sequencer, 1963
 -
 Block diagram of pyrotechnics system, 1963
 -
 Functional block diagram of the attitude control and maneuvering electronics system, 1962
 -
 Functional block diagram of orbit determination operations, 1963
 -
 Functional block diagram of power subsystem, 1963
 -
 Telemetry-data flow chart, 1963
 -
 Tracking-data flow chart, 1963
 -
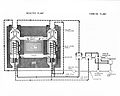
 Blast furnace, 1964
 -
 Flow diagram of Gas-Cooled Reactor. c. 1974.
 -
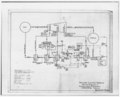
 Pump system flow diagram, 1979
 -
 U.S. sulfur flow diagram adapted from Ober, 1992
 -
 U.S aluminum flow diagram adapted from Wilburn and Wagner, 1993, consumption data from Plunkert, 2002a
 -
 Circular flow model by Hrubovcak, 1995
 -
 Development of Functional Flow Block Diagrams, 1995
 -
 Functional Flow Block Diagram for Mission Control, 1995
 -
 Lay out of production process with flow signs, 1995


.jpg)


.png)
- 21st century
-
 Mail flow diagram, 2005
 -
 Functional Flow Block Diagram, 1950s/2007
 -
 Nassi–Shneiderman diagram, 1972/2012
 -
 Flow diagram for the production of Ammonia, 2010
 -
 Digitalisering infographic, 2013
 -
 Process Flow chart with separate production steps, 2014


General types of flow diagrams[edit]
Flow charts[edit]
The flowchart represents an algorithm, a process, or the step-by-step solution of a problem. See Category:Flow diagrams


Flow maps[edit]
Flow maps show the movement of objects from one location to another. See Category:Flow maps


Sankey diagram[edit]
Sankey diagram are a specific type of flow diagram, in which the width of the arrows is shown proportionally to the flow quantity. See Category:Sankey diagrams


Specific applications and specific types of diagrams[edit]
Flow diagrams in business administration and management[edit]
- Accountancy diagrams
- Main Category:Accounting diagrams
-
Books and Forms used in connection with Wages
-
 Books and Forms used in connection with Stores
 -
 Books and Forms used in connection with Prime Cost
 -
 Books and Forms used in connection with Stock


- Business flow models
-
Flow diagram of Organization Elements of an Industrial Body, 1905
-
Division of labour according to Taylor, 1916
-
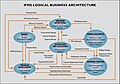 IFMS Logical Business Architecture, 2005

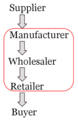
- Supply chain models
-
Systems of advertising, 1906
-
Channels of distribution for various lines of goods by Nystrom, 1915.
-
-


.png)
Flow diagrams in economics[edit]
- Economic flow diagrams
-
Demand for Commodities is not Demand for Labor by John Stuart Mill, 1885
-
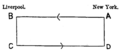
Foreign exchange by John Stuart Mill, 1885
-
1885
-
Economic production and distribution by Seager, 1904
-
Economic Life triange by Nearing, 1909
-
 Method of payment for American purchase of foreign goods, 1919
 -
 Circuit flow of money by W.T. Foster, 1922


- Economic circular flow diagram
- Main Category:Economic circular flow diagrams
Economic circular flow diagram, since 1940s
-
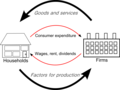 Two sector circular flow diagram, 2008
 -
 Three sector circular flow diagram, 2011
 -
 Four sector circular flow diagram, 2009
 -
 Five sector circular flow diagram, 2006
 -
 With surroundings, 2008


- See also
Flow diagrams in engineering[edit]
- Flow diagram of production process
-
Flow diagram of production process, 1870
-
Flow diagram of production process, since 1870s
-
Lay out of production process with flow signs, since 1940s
- Process flow diagrams
A process flow diagram (PFD) is a diagram commonly used in chemical and process engineering to indicate the general flow of plant processes and equipment. See Category:Process flow diagrams
-
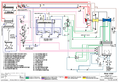 Flow diagram of a steam cycle power plant
 -
 Water flow diagram of a steam cycle power plant
 -
 Water cycles of a coal fired power station
 -
 Electrical energy distribution in a coal fired power plant


- Sankey diagram
-
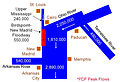 Birds Point-New Madrid Flow
 -
 U.S. Energy Flow Trends – 2002
 -

-
 Energy Flow of Electric Power Plant

Flow diagrams in geography[edit]
- Maps on different levels
- global, continental, national and local
-
Flow map, 1864
-

-
Flow map, 1845

Flow diagrams in systems engineering or software engineering[edit]
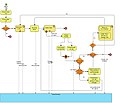
- Activity diagram
An activity diagram is a diagram that shows activities and actions to describe workflows. It is in fact a specific type of flowchart, which shows a sequence of activities. See Category:Activity diagrams


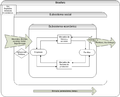
- Business Process Modeling Notation
Business Process Modeling Notation (BPMN) is a standardized graphical notation for drawing business processes in a workflow. See Category:Business Process Modeling Notation
-
 Elements
 -
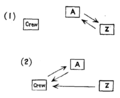
 Relations
 -
 Simple diagram
 -
 More complex diagram


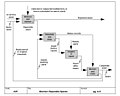
- Data flow diagram
A data flow diagram is a graphical representation of the flow of data through an information system. See Category:Data flow diagrams


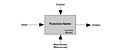
- Function Block Diagram
A Function Block Diagram (FBD) is a diagram, that describes a function between input variables and output variables. A function is described as a set of elementary blocks. Input and output variables are connected to blocks by connection lines. See Category:Function block diagrams
- Functional Flow Block Diagrams
Functional Flow Block Diagrams (FFBD) are multi-tier, time-sequenced, step-by-step flow diagram of the system’s functional flow, see Category:Functional flow block diagrams
-
 Building block
 -
 Simple diagram
 -
Multiple levels
-
An application


- IDEF0
IDEF0 is an Integration Definition for function Modeling, and is a common modeling technique for the analysis, development, re-engineering, and integration of information systems; business processes information modelling. See Category:IDEF0
-
 IDEF Box Format
 -
 Arrow Syntax
 -
 Decomposition Structure
 -
 IDEF Diagram Example


- Nassi-Shneiderman diagram
Nassi-Shneiderman diagram, see Category:Nassi-Shneiderman diagrams


- Process-data diagram
A process-data diagram is a diagram that describes processes and data that act as output of these processes. See Category:Process-data diagram


- Syntax diagrams
Syntax diagrams (also known as railroad diagrams) are a way to represent a context-free grammar. See Category:Syntax diagrams


- UML Activity diagrams
An activity diagram in UML represents the business and operational step-by-step workflows of components in a system. An activity diagram shows the overall flow of control. See Category:UML Activity diagrams


- Waterfall models
- See also Category:Waterfall models