File:U.S. economic variables during President Obama's tenure.png
Jump to navigation
Jump to search

Size of this preview: 800 × 466 pixels. Other resolutions: 320 × 186 pixels | 640 × 373 pixels | 1,024 × 597 pixels | 1,318 × 768 pixels.
Original file (1,318 × 768 pixels, file size: 210 KB, MIME type: image/png)
Captions
Captions
Add a one-line explanation of what this file represents
Understanding the chart[edit]
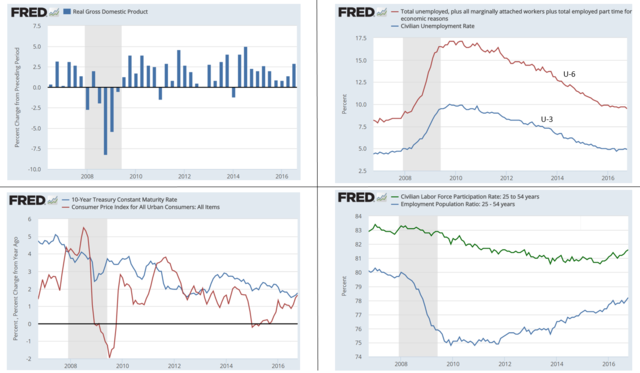
- Economic growth, measured as the change in real GDP, averaged 2.0% from Q2 2009 to Q3 2016. This was slower than the 2.6% average from Q1 1989-Q4 2008.[1] Real GDP grew nearly 3% during President Bush's first term but only 0.5% during his second term. During the Clinton administration, GDP growth was close to 4%, slightly faster than the Reagan administration.[2]
- The unemployment rate (U-3), rose during the Great Recession to peak at 10.0%, then fell back towards full employment by the end of his two terms to 4.9%, similar to 2007 pre-crisis levels during the Bush administration. The wider U-6 rate,which includes marginally attached and those working part-time for economic reasons, followed a similar path to peak at 17.1%, but ended slightly above the pre-crisis levels at 9.5%.[3]
- Inflation (measured by CPI-All Urban Consumers, All Items) fell to a historically low level during his administration, averaging 1.4% from Q2 2009 to Q3 2016, well below the 3.0% average from Q1 1989-Q4 2008.[4]
- Interest rates also fell and remained very low. The yield on the 10-year Treasury bond averaged 2.5% from Q2 2009 to Q3 2016, well below the 5.8% average from Q1 1989-Q4 2008.[4]
References[edit]
- ↑ FRED Real GDP. FRED. Retrieved on November 22, 2016.
- ↑ Why the economy has grown faster under Democratic Presidents. The Economist. Retrieved on November 22, 2016.
- ↑ Unemployment rates U3 and U6. Federal Reserve Economic Database. Retrieved on November 19, 2016.
- ↑ a b FRED CPI and 10-Year Treasury. FRED. Retrieved on November 22, 2016.
Summary[edit]
| Description |
English: Several major U.S. economic variables during President Obama's terms in office. |
| Date | |
| Source |
Own work, based on
|
| Author | Farcaster |
Licensing[edit]
| This chart is ineligible for copyright and therefore in the public domain, because it consists entirely of information that is common property and contains no original authorship. For more information, see Commons:Threshold of originality § Charts
|
File history
Click on a date/time to view the file as it appeared at that time.
| Date/Time | Thumbnail | Dimensions | User | Comment | |
|---|---|---|---|---|---|
| current | 01:52, 20 December 2016 | | 1,318 × 768 (210 KB) | Farcaster (talk | contribs) | User created page with UploadWizard |
You cannot overwrite this file.
File usage on Commons
There are no pages that use this file.
File usage on other wikis
The following other wikis use this file:
- Usage on en.wikipedia.org