Category:Economic statistics for the United States
Jump to navigation
Jump to search
Subcategories
This category has the following 16 subcategories, out of 16 total.
Media in category "Economic statistics for the United States"
The following 200 files are in this category, out of 358 total.
(previous page) (next page)-

-
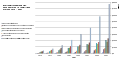
 1 AD to 2008 AD trends in % GDP contribution by major economies of the world.png 9,606 × 6,562; 1,009 KB
-
 12-Month Real Estate Transaction Volume, by Market Category.PNG 883 × 459; 41 KB
-
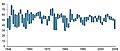
 1790- United States utility patents issued, by year - bar chart.svg 1,200 × 675; 11 KB
-
 19237 TaxFoundation v2.gif 504 × 798; 183 KB
-
 1953- Funding for research and development - US.svg 1,000 × 750; 6 KB
-
 1976- United States utility patents issued, by year - bar chart.svg 1,250 × 675; 4 KB
-
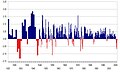
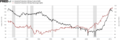
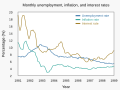 1981–1989 monthly unemployment, inflation, and interest rates.svg 1,000 × 750; 7 KB
-
 2 to 10 year treasury spread vs federal funds rate.png 1,168 × 450; 98 KB
-
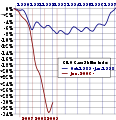
 2 to 10 year yield spread.png 1,461 × 441; 59 KB
-
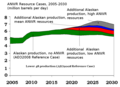 2 USGA ANWR Oil.png 1,053 × 767; 78 KB
-
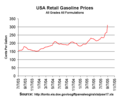 2005energycrisisgasolineprices.png 650 × 530; 6 KB
-
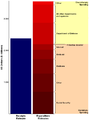 2010 Receipts & Expenditures Estimates.PNG 756 × 1,018; 39 KB
-
 2012 United States Products Imports Treemap.png 1,496 × 1,008; 204 KB
-

-
 AbschrUSAJBRD.PNG 978 × 632; 20 KB
-
 AbschrUSAJBRDengl.png 978 × 632; 26 KB
-
 Advance Estimate of GDP for the Fourth Quarter of 2010 (5396415113).jpg 1,552 × 1,116; 210 KB
-
 AMERICAN HOUSEHOLD WEALTH RECOVERING (4755572925).jpg 893 × 658; 115 KB
-
 American Investments Rebounding (5396929140).jpg 1,538 × 1,100; 203 KB
-

-
 Annual Federal Deficit as a percent of GDP.svg 1,549 × 478; 294 KB
-
 Annual federal outlay.png 682 × 422; 12 KB
-
 Annual-change-us-family-income-1977-2007.png 911 × 623; 17 KB
-
 Annual-change-us-gdp-1977-2007.png 911 × 623; 14 KB
-
 Apparel exports to US.jpg 500 × 348; 41 KB
-
 ARMs Indexes 1996-2006.svg 230 × 182; 208 KB
-

-
 Automobile costs for USA.svg 430 × 550; 25 KB
-
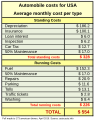
 Automobile Costs in USA.jpg 1,186 × 1,519; 219 KB
-
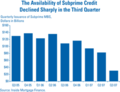 Available Subprime Credit Decline 2007.png 275 × 211; 9 KB
-
 Average Levels of Duties (1875 and 1913).png 745 × 645; 75 KB
-
 Average Tariff Rate in USA (1821-2016).gif 1,285 × 646; 60 KB
-
 Average tariff rates (France, UK, US).png 1,059 × 615; 92 KB
-
 Average Tariff Rates for Selected Countries (1913-2007).png 604 × 309; 112 KB
-
 Average Tariff Rates in USA (1821-2016).png 1,291 × 653; 90 KB
-
 Average Tariff Rates on manufactured products.png 1,176 × 496; 56 KB
-
 Barrons BubblesNewHome.png 762 × 2,000; 57 KB
-
 Bell telephone magazine (1922) (14754053364).jpg 1,658 × 730; 299 KB
-
 BerLohnquUSABRDJapan.PNG 978 × 632; 39 KB
-
 Budget-GWBUSH.jpg 914 × 664; 197 KB
-
 BWS-USA2.svg 800 × 400; 94 KB
-
 Case Shiller indice 20 villes.jpg 1,277 × 696; 134 KB
-
 Case shiller janv09.jpg 915 × 583; 65 KB
-
 Case shiller variation annuelle.jpg 1,201 × 900; 125 KB
-
 Change in household debt - v1.png 1,280 × 720; 111 KB
-
 Changeinmedianbefore-taxincomeUS1989-2004.png 579 × 346; 5 KB
-
 Chart --- Total-US-Consumer-Credit-Outstanding-1945-2011.png 630 × 378; 16 KB
-
 China USA trade.png 5,007 × 1,665; 507 KB
-
 Clinton econ panel v1.png 1,311 × 738; 203 KB
-
 Communication from the secretary of the Treasury transmitting (1854) (17752389029).jpg 4,616 × 1,992; 1.62 MB
-
 Comparing CEO Pay.png 875 × 585; 30 KB
-
 Components of total US debt.svg 1,024 × 768; 22 KB
-
 Components-of-total-US-debt.jpg 1,095 × 767; 53 KB
-
 Composition of U.S. Long-Term Treasury Debt 2000-2014.svg 1,251 × 762; 200 KB
-
 Consumer Loans 1990 2008.png 417 × 250; 12 KB
-
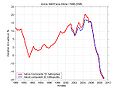
 Consumer Price Index US 1913-2004.png 1,996 × 1,228; 33 KB
-
 Corporate profits dollars and pct gdp 1970-2017.png 674 × 347; 41 KB
-
 CPI vs M2 money supply increases.png 1,168 × 450; 60 KB
-
 CPI1913-2006.svg 800 × 400; 24 KB
-
 Cshpi-peak nov09.svg 300 × 310; 12 KB
-
 Cshpi-peak.JPG 1,556 × 838; 201 KB
-
 Cshpi-peak.svg 300 × 310; 12 KB
-
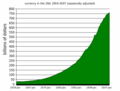 Currency in the USA 1959-2007.png 598 × 455; 8 KB
-
 CurrencyinCirculation.png 630 × 378; 17 KB
-
 Debt and Debt % to GDP - 2010 Budget.png 960 × 720; 9 KB
-
 Debt to Nominal GDP Chart.png 960 × 720; 150 KB
-
 Deficit to Change in Debt Comparison - 2008.png 1,428 × 760; 97 KB
-
 Deficits vs. Debt Increases - 2008.png 960 × 720; 6 KB
-
 Deficits vs. Debt Increases - 2009.png 960 × 720; 6 KB
-
 Desarrollo Económico de USA 1700-1840.jpg 1,056 × 768; 220 KB
-
 Dette publique Etats-Unis 1983-2011.jpg 628 × 893; 85 KB
-
 Dette publique sur PIB Etats-Unis 1983-2002.jpg 625 × 896; 78 KB
-

-
 Distribution of Wealth in the United States.jpg 677 × 482; 75 KB
-
 Dollar value chart.png 453 × 277; 9 KB
-
 Déficit comercial entre Estados Unidos e China entre 1985 e 2015.jpg 1,027 × 739; 114 KB
-
 Déficit commercial (biens) des Etats-Unis.png 518 × 469; 98 KB
-
 Early-80s recession.jpg 483 × 364; 29 KB
-
 Economy Growing (4159109316).jpg 876 × 707; 106 KB
-
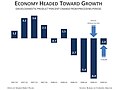 Economy Headed Toward Growth (3798391793).jpg 964 × 720; 143 KB
-
 Education Income Race.jpg 591 × 392; 110 KB
-
 Education Income Sex.jpg 583 × 371; 94 KB
-
 Employment growth by top tax rate.jpg 712 × 453; 65 KB
-
 Employment growth by top tax rate.svg 800 × 600; 13 KB
-
 ExImUSAJBRD.PNG 960 × 594; 57 KB
-
 ExImUSAJFRG.png 960 × 594; 47 KB
-

-
 Federal Budget (1990-2000).svg 600 × 400; 21 KB
-
 Federal receipts by Source Historical 1950-2010.jpg 716 × 431; 80 KB
-
 Federal Receipts by Source.svg 800 × 600; 37 KB
-
 Federal Spending - Cause of Change 2001 to 2009.png 960 × 720; 21 KB
-
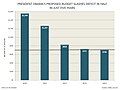
 Fiscally Responsible Obama Agenda (4463870132).jpg 1,138 × 829; 154 KB
-
 Fiscally Responsible Obama Agenda (5081452634).jpg 1,097 × 799; 153 KB
-

-
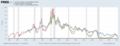
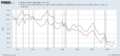
 FRED balance sheet 2004-2019.png 968 × 450; 43 KB
-
 FRED graph of US labor share 1948–2016.png 969 × 450; 64 KB
-
 FRED graph of US labor share 1948–2016.svg 2,138 × 993; 125 KB
-
 Fredgraph2015 5yr.png 1,650 × 963; 88 KB
-
 Fundamentals of Business - Fig. 2.7 - The United States Inflation Rate.jpg 2,086 × 1,670; 149 KB
-
 GDP 2008-2011 (6772671453).jpg 1,126 × 823; 169 KB
-
 GDP growth 1923-2009.jpg 640 × 400; 35 KB
-
 GDP Numbers A Sign Of Economic Progress (4503025593).jpg 1,140 × 825; 89 KB
-
 GDP NUMBERS A SIGN OF ECONOMIC PROGRESS (4755572911).jpg 908 × 652; 96 KB
-
 Gdp versus household income in USA (PL version).png 911 × 623; 19 KB
-
 Gdp versus household income.png 900 × 613; 40 KB
-
 GDPperCap-Hoover-WWII.svg 376 × 298; 19 KB
-

-
 Global Investment in U.S. Real Estate, by Country.PNG 857 × 460; 41 KB
-
 GoodwinEmp.png 977 × 631; 61 KB
-
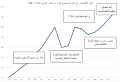 GROWTH1850-ar.svg 923 × 627; 571 KB
-
 GROWTH1850.JPG 1,056 × 768; 80 KB
-
 Hard.png 976 × 631; 122 KB
-
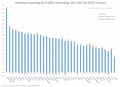 Healthcare Spending by GDP Graph All OECD Countries 2015 to 2017.png 2,485 × 1,811; 221 KB
-
 Homweownership by race.jpg 525 × 317; 83 KB
-
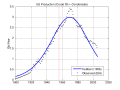 Hubbert US high.svg 512 × 384; 30 KB
-
-
 Importance of Issues for Real Estate in 2015.PNG 395 × 858; 60 KB
-
 Imports vs exports & net imports.png 1,168 × 450; 63 KB
-

-
 Income inequality panel - v1.png 1,309 × 733; 298 KB
-
 Income inequity US (PL version).png 505 × 307; 6 KB
-
 Income inequity US.png 505 × 307; 9 KB
-
 INeigung.PNG 976 × 630; 42 KB
-
 INeigungEngl.PNG 977 × 630; 41 KB
-
 Infaltion usa.png 1,078 × 716; 50 KB
-
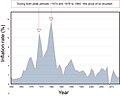
 Inflation and oil price 1969-1989 color corrected.png 1,168 × 620; 33 KB
-
 Inflation and oil.png 5,300 × 2,666; 455 KB
-
 Inflation compared to federal funds rate.jpg 1,444 × 784; 331 KB
-
 Inflation CPI vs. GDP deflator.jpg 960 × 720; 39 KB
-
 InterestRGrowthDiff.PNG 959 × 593; 37 KB
-
 Jetfuel.jpg 678 × 462; 57 KB
-
 Job Growth by U.S. President - v1.png 1,334 × 754; 135 KB
-
 KapaAuslUSABRD.png 978 × 633; 58 KB
-
 KapaAuslUSABRDEngl.png 978 × 633; 45 KB
-
 Kwh per frig.jpg 715 × 505; 114 KB
-
 KZinsDiff.PNG 970 × 604; 36 KB
-
 Leitzinsen.png 977 × 631; 44 KB
-
 LeitzinsenEngl.png 977 × 631; 38 KB
-
 M1 Velocity in the United States 1980s break.png 1,235 × 842; 65 KB
-
 M1 Velocity in the US July 2010.png 1,236 × 842; 67 KB
-
 M2 money supply increases.jpg 1,907 × 794; 320 KB
-
 M3 Velocity in the US.png 911 × 623; 17 KB
-
 Ma sfh yoy.20060925.png 674 × 482; 45 KB
-
 Manufacturing productivity and wages in the United States.svg 750 × 560; 46 KB
-
 MEoC.png 977 × 631; 47 KB
-
 Monetary Base Capture2.JPG 795 × 481; 62 KB
-
 Monetary Base United States 1959-01-01 2018-08-01.png 1,168 × 470; 35 KB
-
 Money supply increases.jpg 1,916 × 794; 353 KB
-
 MTR-Share1.png 836 × 546; 167 KB
-
 NettoauslandsvermögenUSen.PNG 960 × 595; 28 KB
-
 New and existing home sales.png 1,548 × 593; 126 KB
-
 Not in labor force, participation rate.jpeg 1,920 × 900; 377 KB
-
 Number of participants in loyalty programs in the US.jpg 660 × 970; 67 KB
-
 Oil and natural gas extraction in the united states.png 1,423 × 473; 106 KB
-
 Okuns law charter quarter.JPG 480 × 384; 66 KB
-
 Okuns law quarterly differences.svg 301 × 199; 90 KB
-
 Panamakanaal.png 1,800 × 1,200; 139 KB
-
 Path To Economic Recovery (3698221021).jpg 1,136 × 833; 258 KB
-
 PCE vs. CPI 1983 to 2021.png 1,168 × 450; 88 KB
-
 Percent of Income from Capital Gains and Dividends (2006).gif 396 × 291; 10 KB
-
 PHX inventory July2005-March2006.png 432 × 266; 7 KB
-
 PMI 1948 2008.jpg 854 × 361; 26 KB
-
 Pre-Tax Profits of U.S. foreign subsidiaries (2015 BEA Data).jpg 732 × 478; 38 KB
-
 PreisindizesEngl.png 968 × 614; 35 KB
-
 PreisindizesKonsum.png 968 × 614; 34 KB
-
 Premiers etats USA industrie 2006.svg 490 × 376; 95 KB
-
-
 Productivity and employment, 1947-Q2 2014.png 670 × 375; 30 KB
-
 Productivity and Real Median Family Income Growth 1947-2009.png 640 × 398; 115 KB
-
 Productivity and Real Median Family Income Growth in the United States.png 1,024 × 768; 39 KB
-
 Productivity and wages in the United States.svg 750 × 560; 47 KB
-
 ProportionUSexportsimports1960-2004.gif 642 × 364; 21 KB
-
 Q de Tobin.png 440 × 284; 46 KB
-
 Q de Tobin.svg 439 × 284; 31 KB
-
 Quits rate vs unemployment rate.png 1,426 × 478; 105 KB
-
 Real GDP, Real Wages and Trade Policies in the U.S. (1947– 2014).png 861 × 691; 81 KB
-
 Real Median Family Income in the United States 1953 to 1972.png 1,168 × 450; 47 KB
-
 Real Oil Price 1974-1988.png 2,050 × 1,400; 29 KB
-
 Real Wages vs Trade Percent of GDP.svg 824 × 518; 177 KB
-

-
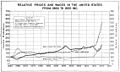 Relative Prices and Wages in the US from 1860 to 1920 Inc, 1922.jpg 1,134 × 680; 122 KB
-
 RentUSAGerFraBri.png 708 × 492; 9 KB
-
 Retail Sales On The Rebound (4636378585).jpg 1,140 × 826; 172 KB
-
 Rise Mortgage Credit Distress 2007.gif 550 × 252; 23 KB
-
 Sectoral balance - private sector components v1.png 1,292 × 713; 67 KB
-
 Share of Total Income and Taxes Paid by Income Group in 2011.jpg 715 × 426; 104 KB
-
 Shiller figure end 2010.svg 512 × 410; 18 KB
-
 Shiller IE2 Fig 2-1.png 2,000 × 1,652; 59 KB
-
 ShortIntRGrowthDiff.PNG 970 × 604; 37 KB
-
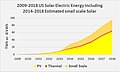 Solar Electric Energy including Small.jpg 484 × 289; 33 KB
-
 St. Louis Adjusted Monetary Base for 100 years.png 1,024 × 618; 70 KB
-
 StaaSchuBis2004.PNG 970 × 603; 42 KB
-
 StaDeficitEngl.PNG 970 × 603; 41 KB
-
 STOCK MARKET (4522934717).jpg 1,127 × 798; 146 KB
-
 Stock market performance by President.png 1,373 × 780; 41 KB
-
 Structure de la RD US, 1953-2004.png 722 × 387; 11 KB
-
 Structure valeur ajoutée USA 2006.svg 404 × 343; 58 KB
-
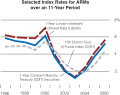
 Taux 10A US 1985-2005.jpg 1,684 × 1,189; 257 KB
-
 Taux 10A US 1995-2005.jpg 1,684 × 1,189; 353 KB


.jpg)
.jpg)
.jpg)
.png)


.jpg)


.png)
.gif)
.png)
.png)
.png)

_(14754053364).jpg)


_des_Etats-Unis.png)

.jpg)
.jpg)


.svg)


.jpg)
.jpg)


.jpg)

.jpg)
.jpg)
.png)


.jpg)

.png)


.jpg)
.gif)


.jpg)


.jpg)


.png)


.svg)


.jpg)


.jpg)


_(17752389029).jpg)