File:OMR-Arena-Automated-Measurement-and-Stimulation-System-to-Determine-Mouse-Visual-Thresholds-Based-pone.0078058.s001.ogv
Jump to navigation
Jump to search
Size of this JPG preview of this OGG file: 800 × 450 pixels. Other resolutions: 320 × 180 pixels | 640 × 360 pixels | 1,280 × 720 pixels.
Original file (Ogg Theora video file, length 1 min 0 s, 1,280 × 720 pixels, 866 kbps, file size: 6.19 MB)
Captions
Captions
Add a one-line explanation of what this file represents
Summary[edit]
| Description |
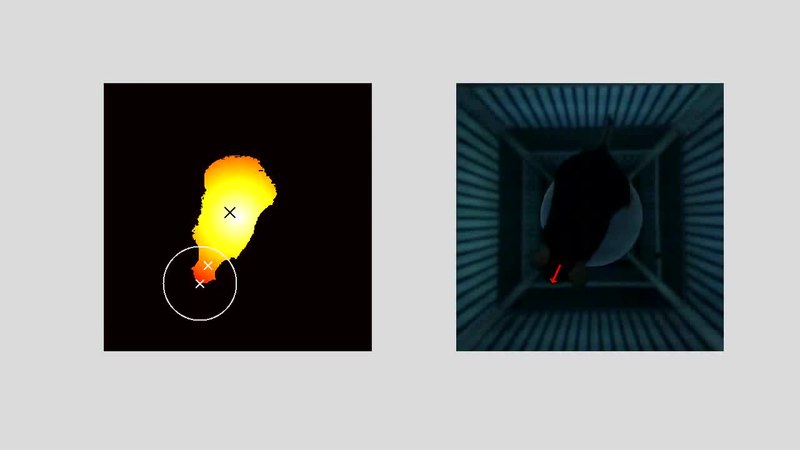
English: Visualization of the tracking algorithm. A video of one mouse placed on the platform in the setup performing OMR. To facilitate the detection of the nose position, coordinates are weighted with a function ranging from 0 at the border of the region around the platform that the mouse can reach with its nose to 1 at the center of the platform. The center of gravity (black X) is calculated based on weighted pixels (see color bar). It is usually located in the animal's hind-quarters region. The nose (white X in circle) is usually detected as the pixel farthest from the center of gravity. The position between the ears (white X) is determined as a center of mass in a circular region (white circle) around the location of the nose. The head-gaze (red arrow in A) is calculated as the vector from the position between the ears to the position of the nose. |
||
| Date | |||
| Source | Video S1 from Kretschmer F, Kretschmer V, Kunze V, Kretzberg J (2013). "OMR-Arena: Automated Measurement and Stimulation System to Determine Mouse Visual Thresholds Based on Optomotor Responses". PLOS ONE. DOI:10.1371/journal.pone.0078058. PMID 24260105. PMC: 3829813. | ||
| Author | Kretschmer F, Kretschmer V, Kunze V, Kretzberg J | ||
| Permission (Reusing this file) |
This file is licensed under the Creative Commons Attribution 3.0 Unported license.
|
||
| Provenance |
|
File history
Click on a date/time to view the file as it appeared at that time.
| Date/Time | Thumbnail | Dimensions | User | Comment | |
|---|---|---|---|---|---|
| current | 04:48, 15 October 2016 | 1 min 0 s, 1,280 × 720 (6.19 MB) | Open Access Media Importer Bot (talk | contribs) | Automatically uploaded media file from Open Access source. Please report problems or suggestions here. |
You cannot overwrite this file.
File usage on Commons
There are no pages that use this file.