File:Kakaobohnenanbau 2005.PNG
Jump to navigation
Jump to search
Size of this preview: 800 × 351 pixels. Other resolutions: 320 × 140 pixels | 640 × 281 pixels | 1,425 × 625 pixels.
Original file (1,425 × 625 pixels, file size: 30 KB, MIME type: image/png)
Captions
Captions
Add a one-line explanation of what this file represents
Summary[edit]
| Description |
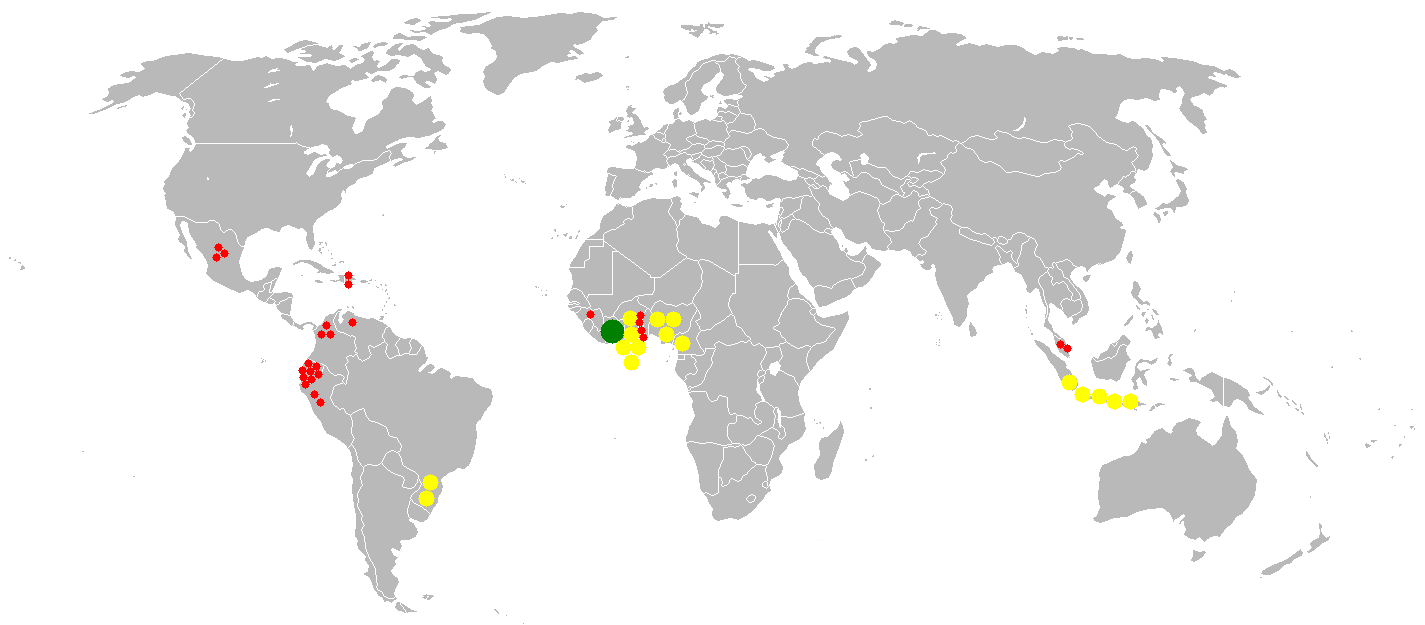
English: This bubble map shows the global distribution of cocoa bean output in 2005 as a percentage of the top producer (Côte d'Ivoire - 1,286,330 tonnes). Legend: Cocoa output in 2005 shown as a percentage of the top producer (Cote d'Ivoire - 1,286,330 tonnes) Notes on the technical realization and data source of the map: English: This map is consistent with incomplete set of data too as long as the top producer is known. It resolves the accessibility issues faced by colour-coded maps that may not be properly rendered in old computer screens. Data was extracted on 18th June 2007 from http://faostat.fao.org/site/336/DesktopDefault.aspx?PageID=336
Deutsch: Die Karte zeigt den Anbau von Kakao im Jahr 2005 in Prozent des Hauptproduzenten Elfenbeinküste (=1.286.330 Tonnen). 100% 10% 1% |
| Date | (UTC) |
| Source |
This file was derived from: 2005cocoa bean.PNG: |
| Author |
|
| This is a retouched picture, which means that it has been digitally altered from its original version. Modifications: deleting legend. The original can be viewed here: 2005cocoa bean.PNG:
|
Licensing[edit]
| This work has been released into the public domain by its author, Vardion, E Pluribus Anthony, Anwar saadat and Generator. This applies worldwide. In some countries this may not be legally possible; if so: Vardion, E Pluribus Anthony, Anwar saadat and Generator grants anyone the right to use this work for any purpose, without any conditions, unless such conditions are required by law.
|
Original upload log[edit]
This image is a derivative work of the following images:
- File:2005cocoa_bean.PNG licensed with PD-author
- 2011-07-01T16:50:10Z Saibo 1425x625 (59340 Bytes) raw descs: {{Information |Description={{en|This [[:en:User:Anwar_saadat/bubble_maps_(FAQ)|bubble map]] shows the global distribution of cocoa bean output in 2005 as a percentage of the top producer (Côte d'Ivoire - 1,286,33
Uploaded with derivativeFX
File history
Click on a date/time to view the file as it appeared at that time.
| Date/Time | Thumbnail | Dimensions | User | Comment | |
|---|---|---|---|---|---|
| current | 15:13, 17 February 2012 | | 1,425 × 625 (30 KB) | Quedel (talk | contribs) | == {{int:filedesc}} == {{Information |Description={{en|1=This bubble map shows the global distribution of cocoa bean output in 2005 as a percentage of the top producer (Côte d'Ivoire - 1,286,330 tonnes). ''Leg |
You cannot overwrite this file.
File usage on Commons
There are no pages that use this file.
File usage on other wikis
The following other wikis use this file:
- Usage on de.wikipedia.org
- Usage on tr.wikipedia.org