Category:Economic maps of the world
Jump to navigation
Jump to search

See also:
Wikimedia category | |||||
| Upload media | |||||
| Instance of |
| ||||
|---|---|---|---|---|---|
| Category combines topics | |||||
| Category contains | |||||
| by country | |||||
meta category criterion 'by country' | |||||
| Instance of | |||||
| Said to be the same as | by nationality | ||||
| |||||
Subcategories
This category has the following 30 subcategories, out of 30 total.
A
B
- Maps of BRICS countries (13 F)
C
- Currency maps of the world (24 F)
D
E
F
G
H
- HDI maps of the world (108 F)
I
- Index of Economic Freedom (33 F)
- Inflation maps of the world (14 F)
L
- Least developed countries (12 F)
M
O
- OECD member maps (28 F)
P
- Price maps of the world (5 F)
S
T
- Tax haven maps (11 F)
- Tax maps of the world (16 F)
U
W
Media in category "Economic maps of the world"
The following 200 files are in this category, out of 301 total.
(previous page) (next page)-
 2000cardistribution.svg 940 × 415; 1.61 MB
-
 2005cocoa bean.PNG 1,425 × 625; 58 KB
-
 2005feldspar.PNG 1,425 × 625; 60 KB
-
 2005gdpIndustrial.png 1,425 × 625; 61 KB
-
 2005gdpServices.png 1,425 × 625; 59 KB
-
 2006-2007 Global Competitiveness Index.png 1,350 × 625; 58 KB
-
 2006budget income.PNG 1,425 × 625; 61 KB
-
 2006net capital export.PNG 1,425 × 625; 62 KB
-
 2006net capital import.PNG 1,425 × 625; 58 KB
-
 2007-2009 World Financial Crisis.svg 636 × 336; 1.81 MB
-
 2009SerbianImports.PNG 1,425 × 625; 72 KB
-
 2010 fundraiser cartogram.png 1,635 × 849; 329 KB
-
 2010 UN Human Development Report Quartiles.png 1,350 × 652; 87 KB
-
 2010 UN Human Development Report.png 1,350 × 652; 88 KB
-
 2010 UNDP Human Development Report Quartiles -2.png 1,350 × 652; 80 KB
-
 2010 UNDP Human Development Report Quartiles.png 1,350 × 652; 65 KB
-
 2010.09.27-LSE-Research-Danny.Quah-Map.png 2,578 × 1,529; 167 KB
-
 20100126205626!World locations of Michelin factories (1).png 1,425 × 625; 61 KB
-
 2011 UN Human Development Report Quartiles.svg 940 × 415; 1.45 MB
-
 20111218185530!BNP perhoofd 2011.png 1,350 × 625; 56 KB
-
 2011ROCVisafree-v4.png 1,425 × 625; 78 KB
-
 49時間以上労働者国際比較.png 926 × 539; 106 KB
-
 49時間以上労働者国際比較(女性).png 828 × 527; 96 KB
-
 49時間以上労働者国際比較(男性).png 871 × 542; 107 KB
-
 800px-101115-ISAF TROOPS PER ONE BILLION GDP.jpg 800 × 364; 48 KB
-
 About Morita Map.jpg 630 × 330; 37 KB
-
 Active Blocs.svg 940 × 477; 2.26 MB
-
 Acute food insecurity forecast for 2020 including coronavirus famines.svg 2,754 × 1,398; 1.22 MB
-
 AFI member countries.jpg 1,047 × 650; 62 KB
-
 Ahold Worldwide.svg 2,731 × 1,402; 5.22 MB
-
 AIIBMap.svg 1,410 × 715; 499 KB
-
 Alliance for Financial Inclusion Map.png 7,192 × 3,318; 2.19 MB
-
 AttaliEleven.PNG 1,425 × 628; 36 KB
-
 Avantage comparatif & commerce britannique.svg 1,200 × 400; 74 KB
-
 Avantage comparatif et commerce britannique.JPG 1,202 × 386; 65 KB
-
 Avantage comparatif et commerce britannique.PNG 1,061 × 280; 24 KB
-
 Average-hourly-earnings.png 3,400 × 2,400; 689 KB
-
 Banque asiatique investissement infrastructures.svg 863 × 443; 1.62 MB
-
 Bharti Airtel countries of operations.svg 2,754 × 1,398; 1.37 MB
-
 Bharti-Airtel-Country-Map.PNG 1,425 × 625; 51 KB
-
 Bijoux Terner Global Reach.png 1,020 × 552; 139 KB
-
 Bill2017.png 1,800 × 1,249; 449 KB
-
 BIMWorldMap.png 856 × 433; 86 KB
-
 Birmania economy.png 800 × 351; 83 KB
-
 Blutec worldwide.png 857 × 435; 98 KB
-
 BNP perhoofd 2012 (1).PNG 1,350 × 625; 38 KB
-

-

-
-
 BRIC.svg 940 × 477; 2.26 MB
-
 BRIMC countries.png 1,427 × 628; 40 KB
-
 BRIMC countries.svg 940 × 477; 2.24 MB
-
 California compared to other countries GDP(nominal) in 2015.png 6,460 × 3,455; 1.14 MB
-
 Canada Exclusive Economic Zones.PNG 2,410 × 1,178; 182 KB
-
 Capita20122.png 1,350 × 652; 50 KB
-
 Carte de la dette publique des pays du monde en 2011 (en % du PIB).png 2,200 × 1,358; 732 KB
-
 Carte des accords conclus par l union europeenne.svg 863 × 443; 1.63 MB
-
 Carte des accords d'association conclus par l'Union européenne.svg 863 × 443; 1.42 MB
-
 Cento zoom.svg 437 × 220; 1.28 MB
-
 Children aged-5-17 engaged in labour.png 3,400 × 2,400; 872 KB
-
 CIT in World Barry Kent.png 1,425 × 625; 58 KB
-
 CIVETS.svg 940 × 477; 1.19 MB
-
 Comercio por mar - Commerce by sea.png 3,037 × 1,694; 245 KB
-
 Commerce mondial 2013.svg 1,929 × 964; 66 KB
-
 Contribution (en points) de la croissance des pays à celle du monde.png 2,200 × 1,250; 438 KB
-
 Convention on mutual administrative assistance in tax matters.svg 863 × 443; 1.54 MB
-
 Core, periphery, and semiperiphery, 1975 - 2002. .png 1,754 × 1,066; 574 KB
-
 Coreperiphery.jpg 2,875 × 1,462; 644 KB
-
 Countries by GNI (nominal) per capita in 2018.png 6,218 × 3,248; 2.06 MB
-
 Countries by GNI (PPP) per capita in 2016.png 6,470 × 3,318; 3.2 MB
-
 Countries by industrial output.PNG 1,559 × 649; 39 KB
-
 Countries by received FDI.png 6,246 × 3,517; 2.02 MB
-
 Countries by Standard & Poor's Foreign Rating.png 1,425 × 625; 37 KB
-
 Countries by total wealth (trillions USD), Credit Suisse.png 7,000 × 3,766; 2.48 MB
-
 Countries that use the dollar.svg 1,650 × 750; 1.23 MB
-
 Countries with economy larger than Germany.png 6,300 × 3,095; 1.56 MB
-
 Countries with most Skyscraper.jpg 1,800 × 820; 177 KB
-
 Country subdivisions by GDP PPP over 200 billion USD.png 4,169 × 2,049; 1.41 MB
-
 CPI-enquêtes- examprélim (sept 2020).svg 2,754 × 1,397; 1.69 MB
-
 CPI-enquêtes- examprélim.svg 2,754 × 1,397; 1.69 MB
-
 Cumulative Current Account Balance per capita.png 1,800 × 820; 229 KB
-
 Cumulative Current Account Balance.png 1,800 × 820; 239 KB
-
 Currency Exchange regimes.png 1,357 × 628; 49 KB
-
 Currency union.PNG 1,337 × 608; 19 KB
-
 Current Account Balance % GDP 2006.PNG 1,425 × 625; 56 KB
-
 Current Account Balance 2006.png 1,425 × 625; 56 KB
-
 Current Account Balance per capita 2006.PNG 1,425 × 625; 55 KB
-
 Current account balance world 2006.PNG 1,353 × 641; 50 KB
-
 Current FATF blacklist Map.png 7,192 × 3,318; 2.1 MB
-
 Current FATF greylist 27 October 2023.png 7,192 × 3,318; 2.18 MB
-
 Daimler manufacturing locations.png 942 × 416; 80 KB
-
 Daimler manufacturing locations.svg 881 × 389; 1.45 MB
-
 DBRS Sovereign Ratings Globally.png 940 × 469; 133 KB
-
 Debt Service of Exports of Goods and Services.png 3,400 × 2,400; 819 KB
-
 Dettepublique2011.jpg 2,200 × 1,356; 307 KB
-
 Deutsche Telekom world locations.svg 840 × 370; 1.37 MB
-
 Developed nation.png 1,357 × 628; 28 KB
-
 Developing 8 countries.PNG 1,357 × 628; 47 KB
-
 Dritte-welt.svg 940 × 477; 1.7 MB
-
 EAGLEs和Nest.jpg 1,766 × 917; 235 KB
-
 Economic integration stages (World).png 1,357 × 628; 39 KB
-
 Economic integration.svg 2,754 × 1,398; 1.19 MB
-
 EITI Members as of August 2014.png 1,004 × 550; 97 KB
-
 Energy-intensity-of-economies-map.png 3,400 × 2,400; 836 KB
-
 Etisalat world presence.png 1,024 × 526; 81 KB
-
 Exchange rate arrangements map.png 6,399 × 3,246; 1.58 MB
-
 Exchange rate arrangements map.svg 863 × 443; 1.07 MB
-
 Expenses Map.gif 720 × 540; 35 KB
-
 Export-Worldmap-2016.svg 1,620 × 774; 470 KB
-
 Exportaciones de los Colleiteiros.png 1,425 × 625; 40 KB
-
 Exports by country map copy3.png 1,357 × 628; 54 KB
-
 External debt to gdp.png 1,946 × 886; 160 KB
-
 Failed States 2014.png 1,600 × 750; 511 KB
-
 FATF Blacklist.svg 863 × 443; 1.55 MB
-
 FATF FSRBs map.png 2,754 × 1,397; 546 KB
-
 FATF-GAFI map.PNG 1,427 × 628; 47 KB
-
 Film-production-map-2015.jpg 3,308 × 1,707; 628 KB
-
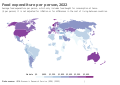 Food expenditure per person per year, OWID.svg 850 × 600; 139 KB
-
 FoodCrisis2007-2008Listed-byFAOMap-World.png 1,425 × 625; 33 KB
-
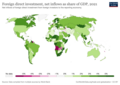 Foreign-direct-investment-net-inflows-as-share-of-gdp.png 3,400 × 2,400; 791 KB
-
 Fossil-fuel-subsidies-gdp.png 3,400 × 2,400; 865 KB
-
 Fossil-fuel-subsidies-per-capita.svg 850 × 600; 168 KB
-
 France Telecom world activities.JPG 1,425 × 625; 62 KB
-
 FY1415DonationsCountryBreakdown.png 1,800 × 1,128; 191 KB
-
 FY1819-Donations-By-Continent-fr.png 2,361 × 1,207; 865 KB
-
 FY1819-Donations-By-Continent-it.png 2,361 × 1,207; 860 KB
-
 FY1819-Donations-By-Continent-ja.png 2,361 × 1,207; 881 KB
-
 G15 Nations.png 1,357 × 628; 45 KB
-
 G20 2008 summit participants.svg 940 × 477; 1.61 MB
-
 G20 members and invited states.svg 940 × 477; 2.43 MB
-
 G20.svg 2,754 × 1,398; 1.06 MB
-
 G20countries (IN).png 2,560 × 1,314; 403 KB
-
 G8+5countries.svg 940 × 477; 2.05 MB
-
 G8g20.svg 1,052 × 744; 402 KB
-
 GAnalytics FR.png 1,671 × 623; 121 KB
-
 GAnalytics KR.png 1,885 × 759; 137 KB
-
 GAnalytics ZH.png 1,778 × 659; 131 KB
-
 GAnalyticsUK.png 1,885 × 611; 128 KB
-
 Gdp-and-labour-force-by-sector.png 1,425 × 1,256; 116 KB
-
 Geographic locations of the Free Economic Zones.png 1,590 × 1,049; 367 KB
-
 Global Competitiveness Index 2008-2009.png 1,350 × 625; 59 KB
-
 Global Competitiveness Index 2008-2009.svg 940 × 477; 1.62 MB
-
 Global Diamond Output in 2005.png 1,425 × 625; 85 KB
-
 GlobalWorld FIC Trade Low L.jpg 2,953 × 2,034; 647 KB
-
 GNI per capita(Lithuania).jpg 6,300 × 3,095; 3.13 MB
-
 Gold Reserves (edited).png 1,920 × 875; 301 KB
-
 GooglePayNovember2018.png 2,560 × 1,314; 374 KB
-
 Guanansonearth.jpg 715 × 308; 30 KB
-
 HBL worldwide.png 2,753 × 1,400; 104 KB
-
 High Income country.png 1,280 × 592; 127 KB
-
 High-income economies 2019.png 6,300 × 3,095; 1.43 MB
-
 IMF advanced UN least developed.svg 940 × 477; 1.58 MB
-
 IMF WEO CAB as GDP.png 1,425 × 625; 34 KB
-
 Indice de desarrollo humano menor y mayor a 0,8.PNG 1,350 × 652; 48 KB
-
 Industria mundo.png 1,357 × 628; 113 KB
-
 Industrialized countries 2007.PNG 1,357 × 628; 49 KB
-
 Industrialized countries 2007.png 1,357 × 628; 49 KB
-
 Industry 1967 - part 1.jpg 4,302 × 2,908; 1.69 MB
-
 Industry 1967 - part 2.jpg 2,172 × 2,889; 890 KB
-
 Industry 1967 - part 3.jpg 4,298 × 2,908; 1.64 MB
-
 Industry 1967 - part 4.jpg 2,175 × 2,901; 817 KB
-
 Inequality-adjusted human development index.svg 1,035 × 531; 1.47 MB
-
 Informal-employment-of-total-non-agricultural-employment.png 3,400 × 2,400; 864 KB
-
 International-finance-clean-energy.png 3,400 × 2,400; 872 KB
-
 Investment percent gdp.png 1,400 × 710; 199 KB
-
 Investment percent gdp.svg 940 × 477; 2.26 MB
-
 Joseph Cross, The Impolicy of Slavery, 1823 Cornell CUL PJM 1039 01.jpg 4,131 × 3,320; 2.19 MB
-
 Kakaobohnenanbau 2005.PNG 1,425 × 625; 30 KB
-
 Karte-laendervertretungen.gif 570 × 320; 31 KB
-
 KarteWeltkraftfahrzeugbestand.png 1,357 × 628; 51 KB
-
 L'industrio en la mondo.jpg 1,357 × 628; 88 KB
-
 Large cities of the world with rent controls.png 2,400 × 1,093; 1.38 MB
-
 Leading Group on Innovative Financing for Development Countries Map.png 7,192 × 3,802; 2.32 MB
-
 List Of Countries With Subway Restaurants.png 1,357 × 628; 40 KB
-
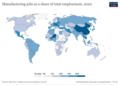 Manufacturing-share-of-total-employment.png 3,400 × 2,400; 761 KB
-
 Map and Scatterplot of countries by Economic Complexity..jpg 2,264 × 2,993; 1.54 MB
-
 Map Expenses.png 1,101 × 483; 167 KB
-
 Map of countries by exports.png 7,680 × 4,320; 1.84 MB
-
 Map of countries by GDP (PPP) per capita in 2021.svg 2,192 × 1,135; 1.62 MB
-
 Map of countries with which New Zealand has free trade agreements.svg 2,754 × 1,398; 1.14 MB
-
 Map of emerging markets.JPG 1,280 × 661; 85 KB
-
 Map of World's High-speed rail Countries.svg 2,754 × 1,398; 1.16 MB
-
 Mapacivets.jpg 779 × 367; 62 KB
-
 Mean Euromoney Country Risk, March 2000 - March 2011.svg 1,080 × 540; 383 KB
-
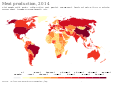 Meat production, OWID.svg 850 × 600; 142 KB
-
 Mediana wieku swiat.png 1,357 × 628; 70 KB
-
 Mercosul.svg 1,002 × 509; 1.8 MB
-
 Mercosulmap123.PNG 1,427 × 628; 35 KB
-
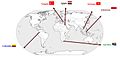
 Metalfrio-pelo-mundo.jpg 800 × 418; 138 KB
-
-
 Middle power Map.PNG 1,500 × 775; 76 KB
-
 Middle powers.png 1,357 × 628; 36 KB
-
 Middle powers.svg 940 × 477; 2.26 MB
-
 MiddlePowers.png 1,357 × 628; 29 KB
-
 Money-committed-to-public-private-partnerships-for-infrastructure.png 3,400 × 2,400; 844 KB
-
 Most protectionist countries in the world 2013.png 2,476 × 1,820; 698 KB
-
 Msciworldmap.png 5,952 × 2,588; 1.49 MB
-
 MTN group global locations.PNG 1,425 × 625; 57 KB
-
 Nabeghlavi Distribution around the World.jpg 980 × 442; 102 KB
-
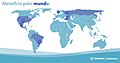
 NBP worldwide.png 2,756 × 1,408; 205 KB


.png)


.PNG)


_in_2015.png)


.png)


_de_la_croissance_des_pays_%C3%A0_celle_du_monde.png)


_per_capita_in_2018.png)
_per_capita_in_2016.png)


,_Credit_Suisse.png)


.svg)


.png)


.png)


.jpg)
.png)


_per_capita_in_2021.svg)


_(14776096191).jpg)


