File:Finance.svg

Original file (SVG file, nominally 360 × 240 pixels, file size: 14 KB)
Captions
Captions
Summary[edit]
| Description |
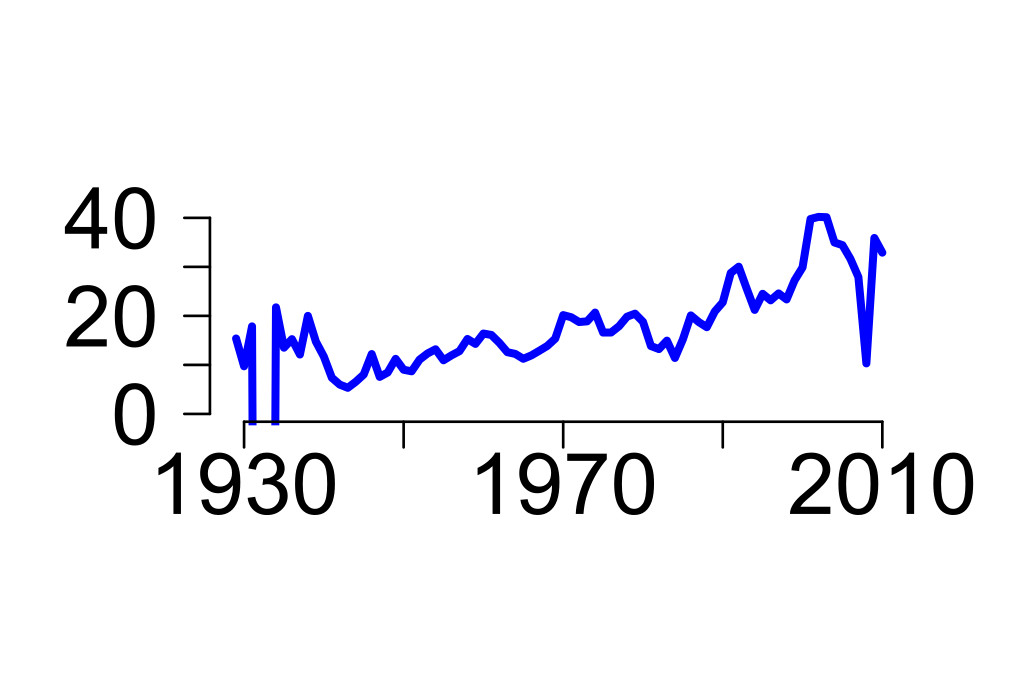
English: Ratio of Finance to Domestic Industries in Table 6.16 of the National Income and Product Accounts, US Bureau of Economic Analysis. |
| Date | |
| Source | Own work |
| Author | DavidMCEddy |
How to create this image using R[edit]
- NOTE: "Edit" and copy this section to get an R script file.
- Wikimedia does not display the R "#" comment characters,
- but they are in the file.
- Table 6.16 of the National Income and Product Accounts,
- US Bureau of Economic Analysis.
- How to download the US Bureau of Economic Analysis
- Table 6.16 and create a plot of finance industry
- profits as a percent of US domestic corporate profits
- using R (www.r-project.org)
- Procedure tested 2012.01.30
- 1. Go to the web interface for the
- National Income and Product Accounts (NIPA)
- of the US Bureau of Economic Analysis
- (http://bea.gov/national/nipaweb).
- Select "List of All NIPA tables".
- From there, select 6.16A, 6.16B, 6.16C, and 6.16D
- in turn. With each one, select "Annual series",
- "Get All Years", and Update.
- Then at the bottom, click "Download All Years (CSV)".
- This should produce local copies of files with names like
- "NIPA Table (1).csv", ..., "NIPA Table (4).csv"
- NOTE: Check to make sure you get annual data,
- because a slight error in following the above process
- can produce quarterly numbers.
- Move or copy these files into a working directory
- for your R session and rename them to the following:
(table6.16.csv <- paste('NIPA6.16', LETTERS[1:4], '.csv', sep=))
- 2. Read the contents of the table
table6.16lines <- lapply(table6.16.csv, readLines)
- Confirm that the first line gives the table numbers:
- 6.16 A, B, C, D
sapply(table6.16lines, '[', 1)
- 3. Get years, Domestic Industries, and Financial:
- rows 5, 7 and 8 in each table.
- Confirm that line 5 starts "Line"
(table6.16data <- lapply(table6.16lines, '[', c(5, 7, 8)))
- NOTE: If line 5 does NOT start "Line", you have the wrong table(s).
get6.16data <- function(x){
   x. <- gsub('\"', , x)
   ys <- strsplit(x., split=',')
   Names <- sapply(ys[-1], '[', 2)
   Names[2] <- gsub(' ', , Names[2])
   yrs <- lapply(ys, '[', -(1:2))
   dat <- lapply(yrs, as.numeric)
   X <- do.call(rbind, dat)
   dimnames(X) <- list(c('year', Names), NULL)
   X
}
- confirm that it works with the first one
get6.16data(table6.16data1)
- Now try all 4
(table6.16Data <- lapply(table6.16data, get6.16data))
- 4. Put them together
str(table6.16AB <- do.call(cbind, table6.16Data[1:2]))
- Identify duplicate years, keep the last
keepAB <- (table6.16AB[1,]<table6.16Data3[1,1])
str(table6.16ABC <- cbind(table6.16AB[, keepAB], table6.16Data3))
keepABC <- (table6.16ABC[1,]<table6.16Data4[1,1]) str(table6.16ABCD <- cbind(table6.16ABC[, keepABC], table6.16Data4))
- 5. transpose, convert to data.frame
str(table6.16 <- as.data.frame(t(table6.16ABCD))) names(table6.16)[2] <- 'DomesticIndustries'
- check years increment one at a time
table(diff(table6.16[,1]))
- 6. Add percent
- table6.16$financePct <- with(table6.16, Financial/DomesticIndustries)
png('finance.png', width=480, height=320, bg="transparent") plot(100*Financial/DomesticIndustries ~ year, table6.16, type='l',
    ylim=c(0, 40), xlab=, ylab=,
    frame.plot=FALSE, col='blue', lwd=3, axes=FALSE)
axis(1, seq(1930, 2010, 20), c(1930, NA, 1970, NA, 2010), cex.axis=1.5) axis(2, seq(0, 40, 10), c(0, NA, 20, NA, 40), las=1, cex.axis=1.5)
- title('Finance as a percent of US Domestic Corporate Profits')
dev.off()
svg('finance.svg', width=4, height=8/3, bg="transparent")
plot(100*Financial/DomesticIndustries ~ year, table6.16, type='l',
    ylim=c(0, 40), xlab=, ylab=,
    frame.plot=FALSE, col='blue', lwd=3, axes=FALSE)
axis(1, seq(1930, 2010, 20), c(1930, NA, 1970, NA, 2010), cex.axis=2) axis(2, seq(0, 40, 10), c(0, NA, 20, NA, 40), las=1, cex.axis=2)
- title('Finance as a percent of US Domestic Corporate Profits')
dev.off()
abline(v=c(1980, 1985))
- post analysis
table6.16[1:9,]
sel34.85 <- with(table6.16, (1933<year)&(year<1986)) sel86.99 <- with(table6.16, (1985<year)&(year<2000)) sel2000 <- with(table6.16, 1999<year)
mean(table6.16$financePct[sel34.85]) # 13.8% mean(table6.16$financePct[sel86.99]) # 23.5% mean(table6.16$financePct[sel2000], na.rm=TRUE) # 32.5%
sel98.08 <- with(table6.16, (1997<year)&(year<2009)) sum(table6.16$Financial[sel98.08])
(.3255-.2347)*3046.4
277/5.5
Licensing[edit]
- You are free:
- to share – to copy, distribute and transmit the work
- to remix – to adapt the work
- Under the following conditions:
- attribution – You must give appropriate credit, provide a link to the license, and indicate if changes were made. You may do so in any reasonable manner, but not in any way that suggests the licensor endorses you or your use.
- share alike – If you remix, transform, or build upon the material, you must distribute your contributions under the same or compatible license as the original.

|
Permission is granted to copy, distribute and/or modify this document under the terms of the GNU Free Documentation License, Version 1.2 or any later version published by the Free Software Foundation; with no Invariant Sections, no Front-Cover Texts, and no Back-Cover Texts. A copy of the license is included in the section entitled GNU Free Documentation License. |
File history
Click on a date/time to view the file as it appeared at that time.
| Date/Time | Thumbnail | Dimensions | User | Comment | |
|---|---|---|---|---|---|
| current | 05:18, 1 February 2012 | | 360 × 240 (14 KB) | DavidMCEddy (talk | contribs) | {{Information |Description ={{en|1=Ratio of Finance to Domestic Industries in Table 6.16 of the National Income and Product Accounts, US Bureau of Economic Analysis. }} |Source ={{own}} |Author =DavidMCEddy |Date |
You cannot overwrite this file.
File usage on Commons
There are no pages that use this file.