File:Employment growth by top tax rate.jpg
Jump to navigation
Jump to search
No higher resolution available.
Employment_growth_by_top_tax_rate.jpg (712 × 453 pixels, file size: 65 KB, MIME type: image/jpeg)
Captions
Captions
Add a one-line explanation of what this file represents
Summary[edit]
| Description |
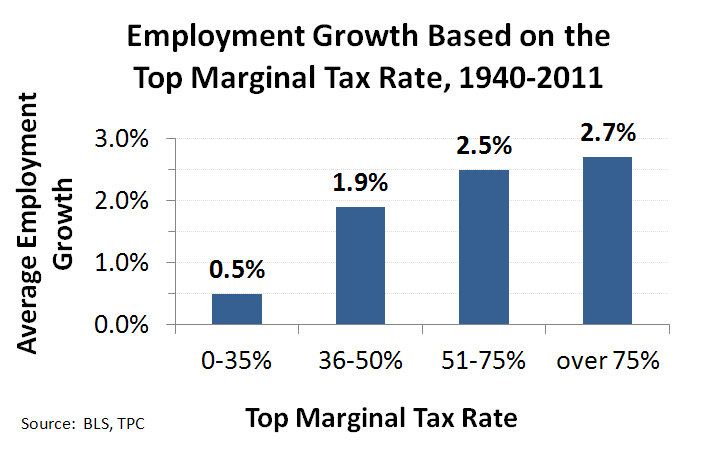
English: Average annual percent growth in U.S. nonfarm employment, by top marginal income tax rate, 1940-2011 |
| Date | |
| Source | Data from U.S. Bureau of Labor Statistics and the Tax Policy Center. |
| Author | w:User:Cupco; based on an original graph from "Rich People’s Taxes Have Little to Do with Job Creation" by Michael Linden, Center for American Progress, June 27, 2011 |
Licensing[edit]
| I, the copyright holder of this work, release this work into the public domain. This applies worldwide. In some countries this may not be legally possible; if so: I grant anyone the right to use this work for any purpose, without any conditions, unless such conditions are required by law. |
Source data table[edit]
Here is the source data from the BLS and TPC sources linked above:
| year | jobs created | top individual income tax rate: |
0-35% | 36-50% | 51-75% | over 75% | |
| 0.5% | 1.9% | 2.5% | 2.7% | column means from below: bar height values | |||
| 1940 | 8.3% | 81.10% | 8.3% | ||||
| 1941 | 11.5% | 81.00% | 11.5% | ||||
| 1942 | 10.0% | 88.00% | 10.0% | ||||
| 1943 | 2.0% | 88.00% | 2.0% | ||||
| 1944 | -2.1% | 94.00% | -2.1% | ||||
| 1945 | -6.6% | 94.00% | -6.6% | ||||
| 1946 | 10.9% | 86.45% | 10.9% | ||||
| 1947 | 2.8% | 86.45% | 2.8% | ||||
| 1948 | 1.0% | 82.13% | 1.0% | ||||
| 1949 | -3.4% | 82.13% | -3.4% | ||||
| 1950 | 7.7% | 91.00% | 7.7% | ||||
| 1951 | 3.1% | 91.00% | 3.1% | ||||
| 1952 | 3.8% | 92.00% | 3.8% | ||||
| 1953 | -0.9% | 92.00% | -0.9% | ||||
| 1954 | -0.7% | 91.00% | -0.7% | ||||
| 1955 | 5.0% | 91.00% | 5.0% | ||||
| 1956 | 2.2% | 91.00% | 2.2% | ||||
| 1957 | -1.0% | 91.00% | -1.0% | ||||
| 1958 | -0.6% | 91.00% | -0.6% | ||||
| 1959 | 4.0% | 91.00% | 4.0% | ||||
| 1960 | -0.8% | 91.00% | -0.8% | ||||
| 1961 | 2.1% | 91.00% | 2.1% | ||||
| 1962 | 2.1% | 91.00% | 2.1% | ||||
| 1963 | 2.4% | 91.00% | 2.4% | ||||
| 1964 | 3.6% | 77.00% | 3.6% | ||||
| 1965 | 4.9% | 70.00% | 4.9% | ||||
| 1966 | 4.6% | 70.00% | 4.6% | ||||
| 1967 | 2.6% | 70.00% | 2.6% | ||||
| 1968 | 3.5% | 75.25% | 3.5% | ||||
| 1969 | 2.9% | 77.00% | 2.9% | ||||
| 1970 | -0.6% | 71.75% | -0.6% | ||||
| 1971 | 1.9% | 70.00% | 1.9% | ||||
| 1972 | 4.4% | 70.00% | 4.4% | ||||
| 1973 | 3.7% | 70.00% | 3.7% | ||||
| 1974 | -0.5% | 70.00% | -0.5% | ||||
| 1975 | 0.5% | 70.00% | 0.5% | ||||
| 1976 | 3.1% | 70.00% | 3.1% | ||||
| 1977 | 4.9% | 70.00% | 4.9% | ||||
| 1978 | 5.1% | 70.00% | 5.1% | ||||
| 1979 | 2.2% | 70.00% | 2.2% | ||||
| 1980 | 0.3% | 70.00% | 0.3% | ||||
| 1981 | -0.1% | 69.13% | -0.1% | ||||
| 1982 | -2.3% | 50.00% | -2.3% | ||||
| 1983 | 3.9% | 50.00% | 3.9% | ||||
| 1984 | 4.2% | 50.00% | 4.2% | ||||
| 1985 | 2.6% | 50.00% | 2.6% | ||||
| 1986 | 1.9% | 50.00% | 1.9% | ||||
| 1987 | 3.1% | 38.50% | 3.1% | ||||
| 1988 | 3.1% | 28.00% | 3.1% | ||||
| 1989 | 1.8% | 28.00% | 1.8% | ||||
| 1990 | 0.3% | 31.00% | 0.3% | ||||
| 1991 | -0.8% | 31.00% | -0.8% | ||||
| 1992 | 1.1% | 31.00% | 1.1% | ||||
| 1993 | 2.5% | 39.60% | 2.5% | ||||
| 1994 | 3.4% | 39.60% | 3.4% | ||||
| 1995 | 1.9% | 39.60% | 1.9% | ||||
| 1996 | 2.4% | 39.60% | 2.4% | ||||
| 1997 | 2.8% | 39.60% | 2.8% | ||||
| 1998 | 2.4% | 39.60% | 2.4% | ||||
| 1999 | 2.5% | 39.60% | 2.5% | ||||
| 2000 | 1.5% | 39.60% | 1.5% | ||||
| 2001 | -1.3% | 38.60% | -1.3% | ||||
| 2002 | -0.4% | 38.60% | -0.4% | ||||
| 2003 | 0.1% | 35.00% | 0.1% | ||||
| 2004 | 1.6% | 35.00% | 1.6% | ||||
| 2005 | 1.9% | 35.00% | 1.9% | ||||
| 2006 | 1.5% | 35.00% | 1.5% | ||||
| 2007 | 0.8% | 35.00% | 0.8% | ||||
| 2008 | -2.6% | 35.00% | -2.6% | ||||
| 2009 | -3.8% | 35.00% | -3.8% | ||||
| 2010 | 0.8% | 35.00% | 0.8% | ||||
| 2011 | 1.4% | 35.00% | 1.4% |
File history
Click on a date/time to view the file as it appeared at that time.
| Date/Time | Thumbnail | Dimensions | User | Comment | |
|---|---|---|---|---|---|
| current | 15:24, 3 October 2012 | | 712 × 453 (65 KB) | Guest2625 (talk | contribs) | narrower |
| 15:04, 3 October 2012 |  | 668 × 433 (63 KB) | Guest2625 (talk | contribs) | narrower version | |
| 09:11, 29 September 2012 |  | 668 × 475 (70 KB) | Guest2625 (talk | contribs) | recrop | |
| 08:52, 29 September 2012 |  | 672 × 429 (71 KB) | Guest2625 (talk | contribs) | better wording | |
| 08:19, 29 September 2012 |  | 569 × 412 (66 KB) | Guest2625 (talk | contribs) | minor formatting; title/axis wording; can revert if old version preferred. | |
| 06:45, 16 September 2012 |  | 551 × 386 (43 KB) | Cupco (talk | contribs) | Redrawn with round numbers for categories. Data from http://data.bls.gov/timeseries/CES0000000001 and http://www.taxpolicycenter.org/taxfacts/displayafact.cfm?Docid=213 |
You cannot overwrite this file.
File usage on Commons
There are no pages that use this file.
File usage on other wikis
The following other wikis use this file:
- Usage on en.wikipedia.org
- Talk:Income tax
- Talk:Income inequality in the United States/Archive 1
- Talk:Income tax in the United States/Archive 1
- Talk:Laffer curve/Archive 2
- User talk:Jimbo Wales/Archive 120
- Talk:Economics/Archive 6
- Talk:Progressive tax/Archive 2
- Wikipedia talk:WikiProject Economics/Archive 9
- Talk:Trickle-down economics/Archive 1