File:Dice Distribution (bar).svg
Jump to navigation
Jump to search

Size of this PNG preview of this SVG file: 512 × 384 pixels. Other resolutions: 320 × 240 pixels | 640 × 480 pixels | 1,024 × 768 pixels | 1,280 × 960 pixels | 2,560 × 1,920 pixels.
Original file (SVG file, nominally 512 × 384 pixels, file size: 10 KB)
Captions
Captions
Add a one-line explanation of what this file represents
Summary[edit]
.svg&action=edit§ion=1)
| Description |
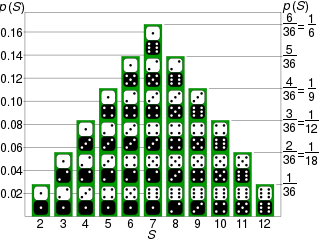
English: w:Probability mass function of sum of two regular dice. Bar graph used to portray discrete density function. Labels on the right correspond to the n/36 results format. |
| Date | |
| Source | Own work using Inkscape and Open Office Draw software. |
| Author | Tim Stellmach |
| Permission (Reusing this file) |
Released into the public domain to the fullest extent legally possible. |
| Other versions | Modified SVG version of graph at Image:Dice Distribution (bar).png. |
| SVG development | This diagram was created with Inkscape. File:.svg and with OpenOffice.org. This diagram uses embedded text that can be easily translated using a text editor. |
.png)
Licensing[edit]
.svg&action=edit§ion=2)
| I, the copyright holder of this work, release this work into the public domain. This applies worldwide. In some countries this may not be legally possible; if so: I grant anyone the right to use this work for any purpose, without any conditions, unless such conditions are required by law. |
File history
Click on a date/time to view the file as it appeared at that time.
| Date/Time | Thumbnail | Dimensions | User | Comment | |
|---|---|---|---|---|---|
| current | 10:43, 20 February 2023 | | 512 × 384 (10 KB) | Cmglee (talk | contribs) | Add simplified fractions |
| 13:20, 28 November 2018 |  | 512 × 384 (9 KB) | Salubrio3000 (talk | contribs) | Made the probabilities all fractions with a denominator of 36, so that these probabilities match with the number of dice combinations. | |
| 21:53, 10 February 2012 |  | 512 × 384 (9 KB) | Cmglee (talk | contribs) | Move bars apart so it is easier to group dice pairs in columns according to Gestalt principles of perception. | |
| 00:16, 9 February 2012 |  | 512 × 512 (9 KB) | Cmglee (talk | contribs) | Align text. | |
| 00:13, 9 February 2012 |  | 512 × 512 (9 KB) | Cmglee (talk | contribs) | Fix missing denominators, add dice images and internationalise labels. | |
| 21:35, 27 September 2006 |  | 778 × 463 (131 KB) | Stellmach (talk | contribs) | {{Information |Description=Density function of sum of two regular dice. Bar graph used to portray discrete density function. |Source=Own work using Inkscape and Open Office Draw software. |Date=Sept 27, 2006 |Author=Tim Stellmach |Permission=Released into |
You cannot overwrite this file.
File usage on Commons
The following 5 pages use this file:
File usage on other wikis
The following other wikis use this file:
- Usage on as.wikipedia.org
- Usage on ba.wikipedia.org
- Usage on be.wikipedia.org
- Usage on bg.wikipedia.org
- Usage on bn.wikipedia.org
- Usage on cbk-zam.wikipedia.org
- Usage on cv.wikipedia.org
- Usage on cy.wikipedia.org
- Usage on de.wikibooks.org
- Usage on el.wikipedia.org
- Usage on en.wikipedia.org
- Usage on eo.wikipedia.org
- Usage on es.wikipedia.org
- Usage on eu.wikipedia.org
- Usage on fi.wikipedia.org
- Usage on fr.wikipedia.org
- Usage on hu.wikipedia.org
- Usage on hy.wikipedia.org
- Usage on it.wikipedia.org
- Usage on ja.wikipedia.org
- Usage on ko.wikipedia.org
- Usage on lt.wikipedia.org
- Usage on lv.wikipedia.org
- Usage on mk.wikipedia.org
- Usage on ms.wikipedia.org
- Usage on nn.wikipedia.org
- Usage on no.wikipedia.org
- Usage on pt.wikipedia.org
- Variável aleatória
- Usuário(a):Gildemar Felix/Teste2 - Variável Aleatória
- Usuária:MCarrera (NeuroMat)/Variável aleatória
- Usuário(a):Gildemar Felix/leitura de fórmulas variaveis aleatorias
- Usuária:MCarrera (NeuroMat)/rascunho
- Usuária:MCarrera (NeuroMat)/Testes/Variável aleatória
- Usuária:MCarrera (NeuroMat)/Testes/Variável aleatória (fórmulas)
- Usuário:Gildemar Felix/Testes/Variável aleatória
- Usage on ru.wikipedia.org
View more global usage of this file.
.svg)
.svg&oldid=734779839)