File:Correlation range dependence.svg
Jump to navigation
Jump to search

Size of this PNG preview of this SVG file: 450 × 360 pixels. Other resolutions: 300 × 240 pixels | 600 × 480 pixels | 960 × 768 pixels | 1,280 × 1,024 pixels | 2,560 × 2,048 pixels.
Original file (SVG file, nominally 450 × 360 pixels, file size: 50 KB)
Captions
Captions
Add a one-line explanation of what this file represents
Summary[edit]
| Description |
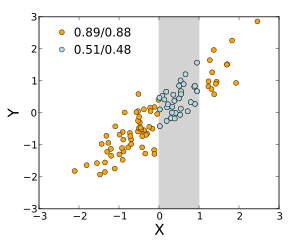
English: Plot depicting how various measures of association are affected when the range of a quantitative variable is limited. |
| Date | |
| Source | Own work |
| Author | Skbkekas |
| SVG development | This plot was created with Matplotlib. |
| Source code | Python codeimport numpy as np
import matplotlib.pyplot as plt
r = 0.9
X = np.random.normal(size=100)
Y = r*X + np.sqrt(1-r**2)*np.random.normal(size=100)
ii = np.flatnonzero( (X>0) * (X<1) )
XR = np.argsort(np.argsort(X))
YR = np.argsort(np.argsort(Y))
def pearson(X,Y):
cc = np.cov(X,Y)
return cc[0,1]/np.sqrt(cc[0,0]*cc[1,1])
r1 = pearson(X, Y)
r2 = pearson(X[ii], Y[ii])
s1 = pearson(XR, YR)
s2 = pearson(XR[ii], YR[ii])
plt.clf()
plt.hold(True)
plt.figure(figsize=(5,4))
plt.axes([0.13,0.13,0.8,0.8])
plt.fill((0,1,1,0,0), (-3,-3,3,3,-3), 'lightgrey', ec='lightgrey')
a = plt.plot(X, Y, 'o', color='orange')
b = plt.plot(X[ii], Y[ii], 'o', color='lightblue')
plt.xlim(-3,3)
plt.ylim(-3,3)
plt.xlabel("X", size=18)
plt.ylabel("Y", size=18)
bx = plt.legend((a,b), ["%.2f/%.2f" % (r1,s1), "%.2f/%.2f" % (r2,s2)],\
'upper left', numpoints=1, handletextpad=0.00001)
bx.draw_frame(False)
plt.savefig("correlation_range_dependence.pdf")
plt.savefig("correlation_range_dependence.svg")
|
Licensing[edit]
I, the copyright holder of this work, hereby publish it under the following license:
This file is licensed under the Creative Commons Attribution 3.0 Unported license.
- You are free:
- to share – to copy, distribute and transmit the work
- to remix – to adapt the work
- Under the following conditions:
- attribution – You must give appropriate credit, provide a link to the license, and indicate if changes were made. You may do so in any reasonable manner, but not in any way that suggests the licensor endorses you or your use.
File history
Click on a date/time to view the file as it appeared at that time.
| Date/Time | Thumbnail | Dimensions | User | Comment | |
|---|---|---|---|---|---|
| current | 14:52, 1 February 2010 | | 450 × 360 (50 KB) | Skbkekas (talk | contribs) | {{Information |Description={{en|1=Plot depicting how various measures of association are affected when the range of a quantitative variable is limited.}} |Source={{own}} |Author=Skbkekas |Date=2010-02-01 |Permission= |other_versions= }} |
You cannot overwrite this file.
File usage on Commons
The following page uses this file:
File usage on other wikis
The following other wikis use this file:
- Usage on el.wikipedia.org
- Usage on en.wikipedia.org
- Usage on en.wikiversity.org
- Usage on ja.wikipedia.org
- Usage on pt.wikipedia.org
- Usage on uk.wikipedia.org