Category:Weather and climate maps
Jump to navigation
Jump to search

 | |||||
| Upload media | |||||
| Instance of | |||||
|---|---|---|---|---|---|
| Subclass of | |||||
| Main subject | |||||
| |||||
Subcategories
This category has the following 22 subcategories, out of 22 total.
!
*
E
F
- Forecasting maps (27 F)
M
- Modelling wind field (9 F)
N
- Netatmo Weathermap (empty)
P
- Paleoenvironmental maps (1 F)
R
S
- Meteorological maps on stamps (12 F)
T
- Tropical cyclone breakpoint maps (14 F)
Pages in category "Weather and climate maps"
This category contains only the following page.
Media in category "Weather and climate maps"
The following 73 files are in this category, out of 73 total.
-
 2008 Pacific Typhoon Season.JPG 1,015 × 1,052; 180 KB
-
 2009 AWS Sites ALL 12 04 2009.jpg 1,584 × 1,224; 1.12 MB
-
 2010 Pacific Typhoon Season.JPG 926 × 817; 158 KB
-
 2012y1m22d Japan weather facsimile(FAX).jpg 640 × 429; 96 KB
-
 20141124TaiwanWeatherMap1.jpg 728 × 531; 194 KB
-
 234 of '(Advanced Text-book of Physical Geography.)' (11163139696).jpg 1,150 × 1,850; 631 KB
-
 29 of 'A School Geography' (11150656105).jpg 502 × 497; 52 KB
-

-
 3cpcp13 202203 202205 Middle East.png 2,000 × 1,200; 426 KB
-
 3cpnp13 202203 202205 Middle East.png 2,000 × 1,200; 595 KB
-
 509 of 'The Land of the Midnight Sun ... New edition' (11288527516).jpg 1,262 × 988; 271 KB
-
 509 of 'The Land of the Midnight Sun ... New edition' (11290391643).jpg 1,251 × 980; 253 KB
-
 510 of 'The Land of the Midnight Sun ... New edition' (11288263083).jpg 1,246 × 972; 225 KB
-
 510 of 'The Land of the Midnight Sun ... New edition' (11288394515).jpg 1,238 × 966; 218 KB
-
 Analysis of observed and modeled mixed layers- NOCAL region. (1983) (18142862046).jpg 2,194 × 2,518; 792 KB
-
 Animated galerna.gif 720 × 540; 32.36 MB
-

-
 Brockhaus and Efron Encyclopedic Dictionary b54 026-3.jpg 1,691 × 2,339; 936 KB
-
 Bulletin - Biological Survey (1895) (20435208051).jpg 3,540 × 2,332; 1.6 MB
-
 Ca. 1277 World Map.jpg 3,093 × 4,520; 16.55 MB
-
 Contours2.png 1,350 × 975; 108 KB
-
 Faithinsertmap.png 465 × 354; 210 KB
-
 Figure12 (905749508295).jpg 700 × 550; 445 KB
-
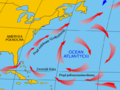
 FMIB 37995 Weather in the North Atlantic.jpeg 775 × 1,441; 255 KB
-
 GrADS GFS 00Z21FEB2020.svg 990 × 765; 2 MB
-
 Hiện tượng La Niña.png 835 × 489; 483 KB
-
 Iowa rainfall.jpg 844 × 561; 67 KB
-
 ITCZ Kilimanjaro.png 599 × 623; 165 KB
-
 Jaanmurtaja-Tarmo-1968.jpg 1,920 × 1,268; 257 KB
-
 January 21, 2017, SPC mesoscale discussion 86.gif 518 × 388; 26 KB
-
 June 12-13 derecho.jpg 300 × 168; 24 KB
-
 Ley chart II.jpg 1,156 × 795; 350 KB
-
 Ley chart IV.jpg 1,185 × 807; 388 KB
-
 Lluvias chiapas.jpg 516 × 440; 129 KB
-
 Lst neo 20131203-20131210.jpg 720 × 720; 174 KB
-
 Meteorological glossary (IA meteorologicalgl00grearich).pdf 612 × 833, 400 pages; 48.17 MB
-
 MoistureChannel.jpg 1,024 × 843; 431 KB
-
 Naoneg.gif 172 × 172; 14 KB
-
 Naopos.gif 172 × 172; 14 KB
-
 NASA Arctic Temperature Change 1981-2007.png 358 × 403; 223 KB
-
 New north pole full and legend.JPG 1,218 × 1,454; 152 KB
-
 NIE 1905 Storm - tracks of centres of low areas (January 1901).jpg 1,511 × 1,006; 441 KB
-
 Noaa wind map 20161016-2.jpg 1,000 × 500; 211 KB
-
 North American Temperature Anomaly March 2012.png 1,800 × 1,800; 2.86 MB
-
 NWS-2020Aug10-Derecho-Summary-Map.png 960 × 540; 523 KB
-
 NWS-2020Aug10-Derecho-Wind-Map.jpg 1,280 × 720; 214 KB
-
 Oproject climate sst 1461.png 1,440 × 900; 570 KB
-
 Orta Araz təbii vilayətində havanın orta illik temperaturu..jpg 1,957 × 1,725; 631 KB
-
 Pakistan cyclone 2015 04 26 00UTC.png 1,012 × 754; 416 KB
-
 Pressure chart anticyclone.jpg 600 × 397; 49 KB
-
 Pressure chart cyclone.jpg 600 × 397; 49 KB
-
 Pressure chart easterly geostrophic flow.jpg 600 × 397; 53 KB
-
 Pressure chart geostrophic flow 2.jpg 600 × 397; 171 KB
-
 Pressure chart geostrophic flow(3).jpg 600 × 397; 55 KB
-
 Pressure chart geostrophic flow.jpg 600 × 397; 51 KB
-
 Pressure chart inertial flow.jpg 600 × 397; 51 KB
-
 PuertoRicoHurricane1899.jpg 500 × 246; 16 KB
-
 Rainfall South Africa 6-12 Feb 2023.jpg 732 × 554; 64 KB
-
 Rudolf Hell führt seinen Wetterkartenschreiber vor (Kiel 44.592).jpg 859 × 863; 75 KB
-
 Sfc190511041230z.png 905 × 595; 1.06 MB
-
 Sfc190511281230z.png 632 × 590; 773 KB
-
 Snowfall Climatology Upstate New York.png 2,338 × 1,857; 560 KB
-
 Trayectoria Esperada de Huracán Matthew.png 610 × 343; 403 KB
-
 U.S. Temperature Climate Normals.png 1,179 × 501; 603 KB
-
 Wetter Luftdruck.jpg 1,269 × 692; 173 KB
-
 Zatokowy.png 626 × 472; 114 KB
-
 Ізабары.jpg 1,527 × 1,421; 497 KB
-
 Ізатэрмы.jpg 1,744 × 1,590; 749 KB
-
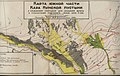 Карта юга Кара Кумской пустыни.jpg 1,168 × 735; 159 KB
-
 Кліматичні пояси Азії.png 533 × 612; 175 KB
-
 Схема дельты реки Аму-Дарья.jpg 715 × 918; 108 KB
-
 南西諸島域が梅雨明けした直後の気圧配置.JPG 419 × 387; 46 KB
-
 天気図1934-03-21-1800.png 357 × 425; 263 KB


.jpg)

%27_(11163139696).jpg)
.jpg)
.jpg)


.jpg)
.jpg)
.jpg)
.jpg)
_(18142862046).jpg)

_in_the_North_Sea_and_Baltic_Sea_at_116_m_height.png)

_(20435208051).jpg)


.jpg)


.jpg)


.jpg)


.jpg)


