Category:Vertical stacked bar charts
Jump to navigation
Jump to search
Subcategories
This category has only the following subcategory.
S
- SVG vertical stacked bar charts (36 F)
Media in category "Vertical stacked bar charts"
The following 121 files are in this category, out of 121 total.
-
-
 2014-2015-2016-2017-2018-conflict-death(1).png 412 × 674; 17 KB
-
 2016 Renewable Electric Energy Profile.jpg 478 × 287; 35 KB
-
 2017 Electric Generation by State by Fuel Source.jpg 1,001 × 532; 156 KB
-
 2017 Profile of US Electric Energy Generation by all Renewables.jpg 484 × 304; 45 KB
-
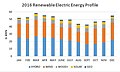
 2018 Profile of US Electric Energy from all Renewables.jpg 484 × 289; 42 KB
-
 2018 Profile of US Electric Energy from Solar.jpg 484 × 289; 31 KB
-
 AFTv5.intention prop.by found.by utility.png 1,024 × 500; 10 KB
-
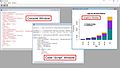 Annotated R Interface.jpg 960 × 540; 63 KB
-
 Annual traffic deaths by age Netherlands 1950-2020.png 1,281 × 833; 82 KB
-
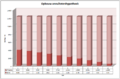
 Annuität Tilgungsanteil.PNG 552 × 376; 11 KB
-
 Annuïteitenhypotheek illustratie.png 987 × 648; 11 KB
-
 Anteil Nimitz.png 1,096 × 568; 91 KB
-
 AnzahlderRaketenstarts.JPG 1,261 × 873; 202 KB
-
 Apstrades rupniecibas struktura.jpg 729 × 589; 169 KB
-
 Authentication-Services-Market-1.png 608 × 292; 42 KB
-
 B2-EIO-LCA - Energy Use.jpg 530 × 344; 27 KB
-
 B2-EIO-LCA-GWP.jpg 530 × 344; 25 KB
-
 Barplot 4.png 314 × 183; 31 KB
-
 Beitrag der Indikatoren zum Gesamtwert des WHI.jpg 4,550 × 2,584; 602 KB
-
 Statistik PAX BER.png 2,500 × 990; 124 KB
-
 BK 2016 GHI ch02 fig01.png 1,061 × 562; 37 KB
-
 Bxl-evolution-linguistique.gif 726 × 444; 48 KB
-
 CAP-Fiber.JPG 307 × 771; 25 KB
-
 CAP-Matrix.JPG 307 × 771; 25 KB
-
 CAP-Total.JPG 307 × 771; 22 KB
-
 Chart platanitos.png 320 × 240; 8 KB
-
 Chart(2).png 482 × 674; 17 KB
-
 China employment by economic sectors.png 1,200 × 1,000; 43 KB
-
 Chowell2014 1918 influenza excess mortality in Spain by province.jpg 1,200 × 827; 210 KB
-
 Costes.png 711 × 400; 45 KB
-
-
 Cuba-trade.png 1,695 × 1,291; 62 KB
-
 Debris object evolution ESA290134.png 3,000 × 1,500; 129 KB
-
 Decline-of-the-worlds-wild-mammals.png 2,615 × 1,924; 269 KB
-
 Destino de los Salvadoreños emigrantes.png 402 × 247; 60 KB
-
 Distribuzione raggi delle curve sulla ferrovia Terni-L'Aquila.png 1,719 × 985; 69 KB
-
 Diversifiacion.JPG 824 × 514; 32 KB
-
-
 Einschaltquoten Wetten, dass.. seit Lanz.png 727 × 487; 11 KB
-
 Electricity sector in Sri Lanka.png 1,087 × 559; 32 KB
-

-
 Fatalities in Terrorist Violence in Pakistan.png 2,851 × 2,071; 63 KB
-
 Financing-ExternalDomestic.png 600 × 279; 33 KB
-
 Frequency of demonstratives2.jpg 872 × 1,010; 235 KB
-
 Frequency of demonstratives4.jpg 872 × 1,010; 231 KB
-
 Försäljningsstatistik för blanddrycker.png 414 × 432; 7 KB
-
 Gender repartition of Le Bistro WP-fr users by account age.png 1,167 × 480; 41 KB
-
 Gizonemak karrera 01.png 480 × 480; 4 KB
-
 Grafik Rohstoff Apfel.jpeg 2,126 × 1,535; 741 KB
-
 Graph indian species.png 579 × 380; 3 KB
-

-
-
 Graph whaling since.png 390 × 625; 43 KB
-
 Güterverkehrsleistung2.jpg 816 × 557; 89 KB
-
 H1N1 virus infection in Mexico 2009-05-06.gif 641 × 320; 18 KB
-
 H1N1 virus infection in USA 2009-05-06.gif 641 × 435; 17 KB
-
 Healthy life expectancy bar chart -Africa -sex.png 1,724 × 587; 73 KB
-
 Healthy life expectancy bar chart -Africa.png 1,724 × 587; 98 KB
-
 Healthy life expectancy bar chart -America -sex.png 1,333 × 576; 62 KB
-
 Healthy life expectancy bar chart -America.png 1,333 × 576; 79 KB
-
 Healthy life expectancy bar chart -Asia -sex.png 1,724 × 593; 74 KB
-
 Healthy life expectancy bar chart -Asia and Oceania -sex.png 1,724 × 593; 77 KB
-
 Healthy life expectancy bar chart -Asia and Oceania.png 1,724 × 593; 102 KB
-
 Healthy life expectancy bar chart -Asia.png 1,724 × 593; 98 KB
-
 Healthy life expectancy bar chart -Europe -sex.png 1,724 × 586; 73 KB
-
 Healthy life expectancy bar chart -Europe.png 1,724 × 586; 91 KB
-
 Healthy life expectancy bar chart -European Union -sex.png 1,249 × 585; 55 KB
-
 Healthy life expectancy bar chart -European Union.png 1,249 × 585; 66 KB
-
 Healthy life expectancy bar chart -Latin America -sex.png 943 × 576; 49 KB
-
 Healthy life expectancy bar chart -Latin America.png 943 × 576; 59 KB
-
 Healthy life expectancy bar chart -world -sex.png 1,724 × 587; 71 KB
-
 Healthy life expectancy bar chart -world.png 1,724 × 587; 98 KB
-
 Human bot MCB distr.jpg 362 × 218; 20 KB
-
 I3 Histogram.PNG 1,036 × 911; 39 KB
-
 Impact top 10.png 1,665 × 2,209; 156 KB
-
 KCRC profits from 1983 to 2010.png 977 × 600; 22 KB
-
 Lkw-Maut in Deutschland.png 1,042 × 688; 60 KB
-
 Marktanteil GPU 2012-2013.png 987 × 641; 8 KB
-
 Marktanteil GPU-Hersteller.png 987 × 641; 10 KB
-

-
 NEC-Plafonds.png 1,116 × 467; 7 KB
-
 Nintendo GameCube Software Titles by Region.png 1,200 × 800; 38 KB
-
 Nombre labels jeu vidéo WP fr.gif 700 × 230; 27 KB
-
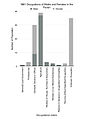
 Occupation of Satterthwaite.jpg 604 × 359; 36 KB
-
 OECD broadband 2013 DK.jpg 1,091 × 464; 145 KB
-
 OECD broadband 2013.jpg 1,091 × 464; 147 KB
-
 Omzetontwikkeling.png 394 × 198; 5 KB
-
 Ooballotnatbodyen.png 658 × 691; 26 KB
-
 Ooballotpmembern.png 659 × 682; 22 KB
-
 Ooballotpnatbodyen.png 657 × 682; 29 KB
-
 Personal computers (million) ITU.png 540 × 810; 13 KB
-
 Poll5.gif 477 × 366; 30 KB
-
 QC elections2.gif 1,040 × 584; 29 KB
-
 Rock mort gaza 2008.JPG 909 × 620; 56 KB
-
 Sachin Tendulkar cricket centuries against countries.JPG 856 × 483; 131 KB
-
 SAIDI-Deutschland-2006-2011.png 721 × 390; 17 KB
-
 SAIDI-Deutschland-2006-2012.png 741 × 380; 4 KB
-
 SeattleHomelessnessBarChart.png 3,600 × 2,400; 98 KB
-
 Serious request geldchart.jpg 362 × 218; 22 KB
-
 SSB husholdningsavfall 1998-2009.gif 369 × 353; 14 KB
-
 Stacked bar.png 790 × 527; 31 KB
-
 Světová poptávka po vodě.jpg 307 × 349; 16 KB
-
 Terras russas século XVIII.jpg 483 × 291; 24 KB
-
 The chances for a certain number in Backgammon.png 676 × 456; 18 KB
-
 Toxic-Matrix.JPG 301 × 771; 23 KB
-
 Toxic-Total.JPG 308 × 771; 21 KB
-

-
 Utility.by intention.1E.by origin.png 2,048 × 1,024; 58 KB
-
 Viewing shares for TV in Sweden 1994-2010.png 1,088 × 520; 32 KB
-
 WHI 11 Abbildung 2-1 Indikatoren.jpg 2,327 × 1,417; 543 KB
-
 Wikidetox - Attacks by activity level.png 515 × 391; 27 KB
-
 Wikidetox Attacks by activity level.jpg 1,035 × 935; 65 KB
-
 Worldwide nuclear testing fr.png 676 × 458; 20 KB
-
 Worldwide nuclear testing.png 682 × 465; 20 KB
-
 Your Name's Revenue Chart.png 952 × 461; 53 KB
-
 Zewener bevoelkerungsstatistik 10956 image001.gif 970 × 604; 40 KB
-
 Zutabe diag 002.png 480 × 480; 3 KB
-
 Статистика поступления в ВУЗы.jpg 800 × 378; 43 KB
-
 Формы легионеллеза в Европе.png 831 × 601; 23 KB
-
 諫早湾岸6町の土地利用.jpg 480 × 303; 19 KB

.png)


.png)


.PNG)
_July_1997-_June_2014.PNG)


_ITU.png)


