Category:Valid SVG created with Gnuplot code
Jump to navigation
Jump to search

Subcategories
This category has the following 5 subcategories, out of 5 total.
Media in category "Valid SVG created with Gnuplot code"
The following 47 files are in this category, out of 47 total.
-
 6 petal flower.svg 1,000 × 1,000; 330 KB
-
 7 Petal rose.svg 713 × 717; 37 KB
-
 Absorption coefficient of water.svg 850 × 680; 12 KB
-
 Affine conn eg2.svg 1,000 × 1,000; 105 KB
-
 Affine connection example.svg 1,000 × 1,000; 101 KB
-
 Archimedes performance.svg 1,280 × 960; 25 KB
-
 B2 optimization function.svg 800 × 600; 1.26 MB
-
 Bamberg Bevoelkerungsentwicklung.svg 1,400 × 400; 81 KB
-
 Butterfly transcendental curve.svg 600 × 600; 24 KB
-
 Cobb–Douglas Function.svg 600 × 480; 111 KB
-
 COVID-19-Pandemie - AS (Amerikanisch-Samoa) - Infizierte (800px).svg 800 × 450; 481 KB
-
 COVID-19-Pandemie - CY (Zypern) - Tote (800px).svg 800 × 450; 472 KB
-

-
 COVID-19-Pandemie - GI (Gibraltar) - Tote (800px).svg 800 × 450; 460 KB
-
 COVID-19-Pandemie - MS (Montserrat) - Tote (800px).svg 800 × 450; 448 KB
-
 COVID-19-Pandemie - TK (Turkmenistan) - Infizierte (800px).svg 800 × 450; 146 KB
-
 COVID-19-Pandemie - VG (Britische Jungferninseln) - Tote (800px).svg 800 × 450; 466 KB
-
 Einwohnerentwicklung von Oberursel (Taunus) - ab 1871.svg 800 × 400; 50 KB
-
 Einwohnerentwicklung von Oberursel (Taunus).svg 800 × 400; 66 KB
-
 Envelope cast.svg 600 × 480; 117 KB
-
 Exp.svg 800 × 600; 29 KB
-
 FatTrifolium.svg 1,000 × 1,000; 472 KB
-
 Gexp im.svg 800 × 600; 289 KB
-

-
 Interrupce CZ.svg 600 × 480; 29 KB
-
 KleinBottle-01.svg 668 × 600; 220 KB
-
 Laplace pdf log.svg 800 × 600; 13 KB
-
 Max paraboloid.svg 700 × 560; 263 KB
-
 Multiple 1-petal rose curves and it's miror images.svg 1,000 × 2,000; 342 KB
-
 Multiple 4-petal rose curves.svg 1,000 × 1,000; 169 KB
-
 Ménages allocataires (Assistance sociale, Québec).svg 600 × 400; 64 KB
-
 Nephroide.svg 600 × 600; 8 KB
-
 Parabola circle.svg 440 × 240; 19 KB
-
 Pearson type VII distribution log-PDF.svg 400 × 300; 132 KB
-
 Pearson type VII distribution PDF.svg 400 × 300; 74 KB
-
 RISCiX performance.svg 1,280 × 960; 22 KB
-
 Résultats électoraux de D'Arcy-McGee (graphique).svg 500 × 350; 33 KB
-
 Résultats électoraux de Gouin (graphique).svg 500 × 350; 31 KB
-
 Résultats électoraux de Pointe-aux-Trembles (graphique).svg 600 × 400; 36 KB
-
 Résultats électoraux de Rosemont (graphique).svg 600 × 400; 41 KB
-
 Résultats électoraux de Saint-Henri-Sainte-Anne (graphique).svg 600 × 400; 33 KB
-
 Résultats électoraux de Vimont (graphique).svg 600 × 400; 37 KB
-
 Superellipse gnuplot.svg 600 × 480; 17 KB
-
 Temperature anomalies 2000s.svg 1,024 × 768; 606 KB
-
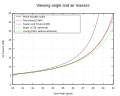 Viewing angle and air masses (reduced).svg 600 × 480; 42 KB
-
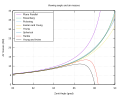 Viewing angle and air masses.svg 600 × 480; 35 KB
-
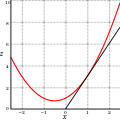 X2+X+1.svg 300 × 300; 1 KB


_-_Infizierte_(800px).svg)
_-_Tote_(800px).svg)
_-_Tote_(800px).svg)
_-_Tote_(800px).svg)
_-_Tote_(800px).svg)
_-_Infizierte_(800px).svg)
_-_Tote_(800px).svg)
_-_ab_1871.svg)
.svg)


.svg)


.svg)


.svg)
.svg)
.svg)
.svg)
.svg)
.svg)


.svg)

