Category:Ukrainian-language SVG diagrams
Jump to navigation
Jump to search
Subcategories
This category has only the following subcategory.
Media in category "Ukrainian-language SVG diagrams"
The following 200 files are in this category, out of 300 total.
(previous page) (next page)-
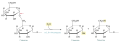 1 6glucosidase reaction.svg 681 × 245; 23 KB
-
 6 week human embryo nervous system uk.svg 1,087 × 608; 37 KB
-
 Accreting coast Image6-uk.svg 1,481 × 697; 15 KB
-
 Acoustic guitar-uk.svg 512 × 705; 26 KB
-
 Action potential ukr.svg 465 × 458; 97 KB
-
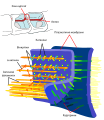 Adherens Junctions structural proteins-uk.svg 504 × 579; 193 KB
-
 Adipocytes.svg 383 × 378; 96 KB
-
 Administrative divisions of Germany.svg 1,037 × 519; 929 KB
-
 Air conditioning unit-uk.svg 1,157 × 967; 93 KB
-
 Alanine transamination.svg 272 × 298; 12 KB
-
 Alcoholic fermentation uk.svg 644 × 129; 16 KB
-
 Aldebaran-Sun comparison-uk.svg 772 × 768; 2 KB
-
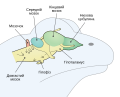 Amphibian brain uk.svg 198 × 159; 60 KB
-
 Anatomy of the Human Ear uk.svg 658 × 516; 329 KB
-
 Angiosperm life cycle diagram uk.svg 424 × 471; 300 KB
-
 Animal cell structure uk.svg 553 × 404; 174 KB
-
 Animal mitochondrion diagram uk.svg 574 × 366; 220 KB
-
 Aquifer uk.svg 672 × 665; 36 KB
-
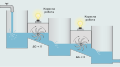
 Artesian Well uk.svg 734 × 425; 7 KB
-
 AT DNA base pair uk.svg 671 × 360; 18 KB
-
 Atmosphere layers-uk.svg 457 × 2,688; 46 KB
-
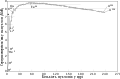
 Atmospheric electromagnetic opacity.svg 1,650 × 780; 105 KB
-
 ATP or GTP cap.svg 475 × 312; 142 KB
-
 AUT-CRO 2008-06-08 (uk).svg 534 × 738; 46 KB
-
 Autorecessive uk.svg 1,350 × 1,580; 17 KB
-
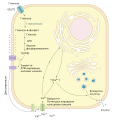
 Average prokaryote cell- uk.svg 529 × 402; 230 KB
-
 Bacterial biosynthesis of arginine.svg 385 × 1,141; 413 KB
-
 Bacterial morphology diagram-uk.svg 825 × 762; 186 KB
-
 Badminton court uk.svg 900 × 650; 35 KB
-
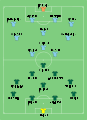
 Barcelona vs Man Utd 2009-05-27 (uk).svg 534 × 738; 54 KB
-
 Benzene acylation.svg 593 × 154; 20 KB
-
 Benzene alkylation.svg 526 × 112; 16 KB
-
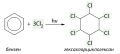 Benzene chlorination on light.svg 368 × 166; 16 KB
-
 Benzene electrophilic substitution.svg 702 × 136; 14 KB
-
 Benzene halogenation.svg 363 × 112; 13 KB
-
 Benzene hydrogenation reaction.svg 283 × 109; 9 KB
-
 Benzene nitration.svg 526 × 112; 12 KB
-
 Benzene Orbitals uk.svg 750 × 400; 30 KB
-
 Benzene oxydation.svg 380 × 132; 18 KB
-
 Benzene sulfonation.svg 526 × 127; 19 KB
-
 Bicycle diagram-uk.svg 850 × 500; 403 KB
-
 BigBang UA.svg 744 × 1,052; 167 KB
-
 Binding energy curve - common isotopes-uk.svg 671 × 441; 30 KB
-
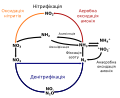 Biochemical nitrogen cycle.svg 512 × 415; 11 KB
-
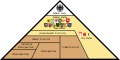
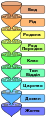 Biological classification uk.svg 230 × 590; 63 KB
-
 Blastocyst uk.svg 608 × 516; 106 KB
-
 Bone cross-section uk.svg 1,000 × 500; 481 KB
-
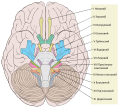 Brain human normal inferior view with labels uk.svg 579 × 523; 676 KB
-
 British Isles Euler Diagram 13-uk.svg 532 × 416; 32 KB
-
 Butyric acid fermentation.svg 634 × 769; 226 KB
-
 CAMP methabolism.svg 354 × 541; 65 KB
-
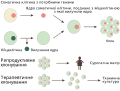
 Cell death.svg 865 × 715; 242 KB
-
 Cell junction simplified uk.svg 686 × 128; 90 KB
-
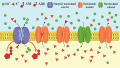
 Cell membrane detailed diagram 4 uk.svg 1,690 × 1,982; 532 KB
-
 Cellular respiration uk.svg 865 × 677; 1.21 MB
-
 Cellular tight junction-uk.svg 499 × 646; 178 KB
-
 Centrosome.svg 698 × 595; 52 KB
-
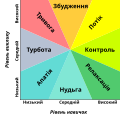 Challenge vs skill uk.svg 1,200 × 1,200; 6 KB
-
 Characteristics of life-uk.svg 512 × 358; 22 KB
-
 Chemical potential of a solvent in the presence of a solute.svg 577 × 649; 82 KB
-
 Chromatin Structures uk.png 1,696 × 432; 190 KB
-
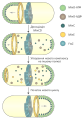
 Cloning diagram ukr.svg 512 × 385; 18 KB
-
 Cloud types uk.svg 960 × 590; 245 KB
-
 CMVschema-uk.svg 721 × 496; 32 KB
-
 Comparison of several satellite navigation system orbits-uk.svg 512 × 512; 55 KB
-
 Complete diagram of a human spermatozoa uk.svg 612 × 592; 460 KB
-
 Complete neuron cell diagram uk.svg 819 × 596; 707 KB
-
 Cone-response-uk.svg 512 × 322; 46 KB
-
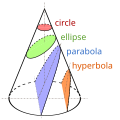 Conic Sections.svg 512 × 512; 13 KB
-
 Conjugation uk.svg 846 × 789; 80 KB
-
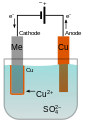 Copper electroplating principle (multilingual).svg 512 × 700; 10 KB
-
 Cori cycle uk.svg 397 × 220; 8 KB
-
 Culex mosquito life cycle uk.svg 791 × 732; 1.13 MB
-
 Culex pipiens diagram uk.svg 772 × 813; 432 KB
-
 Cytoskeletal proteins identity.svg 485 × 601; 254 KB
-
 Dependence of velocity on substrate concentration.svg 541 × 418; 3 KB
-
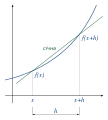 Derivative ukr.svg 1,158 × 1,282; 11 KB
-
 Desmosome cell junction uk.svg 556 × 588; 360 KB
-
 Desmosome scheme.svg 392 × 453; 231 KB
-
 Diagram human cell nucleus uk.svg 462 × 378; 117 KB
-
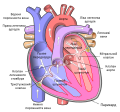 Diagram of the human heart uk.svg 691 × 645; 448 KB
-
 Diagram of the ShKAS feed system operation - uk.svg 1,349 × 1,095; 538 KB
-
 Difference DNA RNA-uk.svg 1,371 × 1,097; 150 KB
-
 Digestive system diagram uk.svg 671 × 821; 298 KB
-
 DNA chemical structure uk.svg 1,500 × 1,750; 12 KB
-
 DNA paternity testing.svg 567 × 496; 13 KB
-
 Dosage compensation uk.svg 512 × 799; 190 KB
-
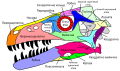 Dromaeosaurus skull uk.svg 680 × 400; 358 KB
-
 Dynamic instability.svg 562 × 509; 154 KB
-
 Dyson Sphere Diagram-uk.svg 900 × 900; 24 KB
-
 Electricity in France uk.svg 600 × 450; 61 KB
-
 Electromagnetic-Spectrum.svg 816 × 1,239; 118 KB
-
 Endomembrane system diagram uk.svg 614 × 498; 295 KB
-
 Energy coupling.svg 307 × 633; 8 KB
-
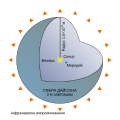
 Ergosphere of a rotating black hole.svg 1,000 × 700; 9 KB
-
 Eye blood supply.svg 574 × 413; 38 KB
-
 F actin.svg 602 × 157; 37 KB
-
 F26BP regulation.svg 631 × 485; 12 KB
-
 FAD reduction.svg 669 × 388; 33 KB
-
 Fair use rationale scheme by Albedo (uk).svg 704 × 1,011; 43 KB
-
 Feedback inhibition of isoleucine synthesis.svg 359 × 511; 9 KB
-
 Figchannel2017ab uk.svg 800 × 374; 67 KB
-
 Flagellum base diagram uk.svg 600 × 500; 109 KB
-
 Folding of epithelial sheet.svg 453 × 546; 319 KB
-
 Formin.svg 514 × 642; 115 KB
-
 FtsZ cytokinesis.svg 2,421 × 1,489; 182 KB
-
 G-protein.svg 2,100 × 1,664; 510 KB
-
 GalacticRotation2 uk.svg 250 × 150; 9 KB
-
 Gamma-TuRC.svg 307 × 323; 58 KB
-
 Gap cell junction-uk.svg 582 × 409; 82 KB
-
 GC DNA base pair uk.svg 638 × 401; 21 KB
-
 Genetic switch CI.svg 817 × 1,061; 334 KB
-
 Genetic switch Cro.svg 817 × 713; 233 KB
-
 Genomic imprinting.svg 964 × 885; 552 KB
-
 GER-POL 2008-06-08 (uk).svg 534 × 738; 46 KB
-
 Glc6P fate.svg 389 × 331; 6 KB
-
 Gluconeogenesis uk.svg 648 × 684; 53 KB
-
 Glucose precursors.svg 547 × 528; 11 KB
-
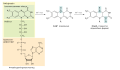
 Glucuronic acid production.svg 665 × 169; 81 KB
-
 Glucuronic acid production2.svg 659 × 200; 82 KB
-
 Glycogen phophorylase mechanism.svg 1,046 × 357; 41 KB
-
 Glycogen phophorylase regulation.svg 1,266 × 1,066; 16 KB
-
 Glycogen phosphorylase reaction.svg 733 × 138; 23 KB
-
 Glycogenolysis activation by epinephrine.svg 811 × 1,004; 33 KB
-
 Glycogenolysis uk.svg 582 × 739; 21 KB
-
 Glycolysis 10.svg 527 × 297; 16 KB
-
 Glycolysis feeder pathways.svg 787 × 759; 38 KB
-
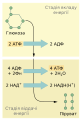 Glycolysis phases.svg 234 × 342; 9 KB
-
 Glycolysis1.svg 583 × 170; 20 KB
-
 Glycolysis3.svg 641 × 144; 18 KB
-
 Glycolysis4.svg 792 × 487; 64 KB
-
 Glycolysis5.svg 303 × 135; 6 KB
-
 Glycolysis6.svg 557 × 405; 23 KB
-
 Glycolysis7.svg 508 × 135; 13 KB
-
 Glycolysis8.svg 819 × 242; 28 KB
-
 Glycolysis9.svg 228 × 99; 7 KB
-
 GP isoforms allosteric regulation.svg 1,204 × 985; 13 KB
-
 Gray72-uk.svg 732 × 526; 171 KB
-
 H-R diagram-uk.svg 550 × 700; 22 KB
-
 H-R diagram.svg 550 × 700; 21 KB
-
 Hand pump-uk.svg 631 × 717; 207 KB
-
 Headful packaging.svg 968 × 392; 60 KB
-
 Heritability testing.svg 1,140 × 894; 96 KB
-
 Hexokinase kinetic.svg 371 × 318; 3 KB
-
 Histone mRNA.svg 955 × 149; 20 KB
-
 History of the Universe-uk.svg 512 × 396; 81 KB
-
 HMMGraph uk.svg 708 × 546; 43 KB
-
 Human Erythrocytes OsmoticPressure PhaseContrast Plain uk.svg 1,280 × 580; 557 KB
-
 Human skeleton back uk.svg 448 × 826; 893 KB
-
 Human skeleton front uk.svg 436 × 842; 983 KB
-
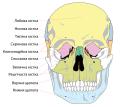 Human skull front bones uk.svg 633 × 563; 111 KB
-
 Human skull side bones uk.svg 552 × 378; 125 KB
-
 Hydroelectric system.svg 555 × 309; 18 KB
-
 Hydrolysis of G6P in ER.svg 761 × 418; 17 KB
-
 Igf2 imprinting.svg 528 × 340; 60 KB
-
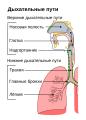 Illu conducting passages rus.svg 259 × 361; 87 KB
-
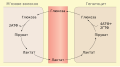
 Induktion-Deduktion uk.svg 800 × 500; 6 KB
-
 Insulin biosynthesis.svg 700 × 963; 74 KB
-
 Insulin glucose metabolism uk.svg 629 × 416; 16 KB
-
 Insulin primary structure.svg 1,211 × 155; 4 KB
-
 Insulin secretion.svg 769 × 807; 21 KB
-
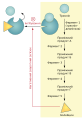
 Int xis regulation.svg 682 × 1,073; 546 KB
-
 Integration excision.svg 800 × 519; 89 KB
-
 Intermediate filament uk.svg 664 × 448; 99 KB
-
 Ion transport.svg 447 × 253; 66 KB
-
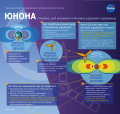 Juno infographic v5 ukr.svg 512 × 486; 979 KB
-
 JWST-HST-primary-mirrors-uk.svg 1,414 × 957; 47 KB
-
 L-D isomerism.svg 227 × 217; 35 KB
-
 Labda phage genom uk.svg 450 × 447; 51 KB
-
 Lambda cohesive ends.svg 721 × 579; 167 KB
-
 Lambda decision.svg 598 × 947; 174 KB
-
 Lambda phage uk.svg 198 × 284; 35 KB
-
 LaserBeam.svg 744 × 1,052; 56 KB
-
 Licensing tutorial uk.svg 612 × 1,200; 131 KB
-
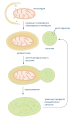
 Lifecycle moss svg diagram uk.svg 488 × 736; 310 KB
-
 LIGO schematic (multilang).svg 1,125 × 675; 12 KB
-
 Lineweaver-Burk plot.svg 530 × 440; 4 KB
-
 Lytic cycle expression.svg 1,480 × 500; 320 KB
-
 Macroautophagy uk.svg 940 × 1,496; 74 KB
-
 Magical square investment uk.svg 260 × 260; 12 KB
-
 Main protein structure levels uk.svg 434 × 757; 279 KB
-
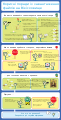
 Main symptoms of diabete uk.svg 1,074 × 1,052; 791 KB
-
 Mammalian biosynthesis of arginine.svg 499 × 1,060; 401 KB
-
 Mature flower diagram uk.svg 423 × 217; 60 KB
-
 Medulla section uk.svg 527 × 274; 115 KB
-
 MEX-URU 2010-06-22 (uk).svg 534 × 738; 33 KB
-
 Microtubule.svg 624 × 298; 96 KB
-
 MinCDE.svg 1,662 × 2,358; 365 KB
-
 Mindmap.svg 1,006 × 345; 19 KB
-
 Mitochondrial DNA uk.svg 1,930 × 1,560; 55 KB
-
 Modernphysicsfields uk.svg 787 × 355; 126 KB
-
 Molecular basis of Raoults law.svg 595 × 478; 68 KB
-
 Month - Knuckles (uk).svg 450 × 220; 32 KB
-
 Moon diagram uk.svg 2,770 × 2,570; 274 KB
-
 MreB PBP2.svg 1,733 × 1,213; 379 KB
-
 NcRNA biogenesis (vector).svg 1,067 × 837; 89 KB
-
 Neural crest uk.svg 855 × 222; 161 KB
-
 New Horizons Pluto approach timeline ukr.svg 1,178 × 650; 7 KB
-
 Nitrogen Cycle uk.svg 512 × 384; 203 KB
-
 Nucleation.svg 749 × 477; 140 KB


.svg)


.svg)


.svg)


.svg)


.svg)


.svg)


.svg)


.svg)


.svg)


