Category:US National Archives series: Gulf of Maine Fisheries Maps and Charts, 1978 - 1984
Jump to navigation
Jump to search
This series consists of maps and charts related to oil and gas operations, water-column trajectories for oil discharges, distribution of fish larvae, longitudinal cross-sections of minimum depth between Nantucket and Cape Sable, phytoplankton concentrations, seabed gradients, topography of the Continental Shelf, Gulf of Maine, surface temperatures and temperature gradients, stock development areas, surface and bottom temperatures and salinities, zoogeographic provinces, speed and direction of tidal currents, distribution of groups of mollusc species, and diagrams of water circulation.
Media in category "US National Archives series: Gulf of Maine Fisheries Maps and Charts, 1978 - 1984"
The following 9 files are in this category, out of 9 total.
-
 Latitudinal Compression of Surface Temperatures - NARA - 7384901.jpg 3,346 × 3,229; 2.31 MB
-
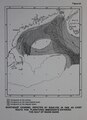
 Northeast Channel - DPLA - 22b60344bfb0099b9290a08bd64897c6 (page 1).jpg 2,981 × 4,098; 2.41 MB
-
 Northeast Channel - DPLA - 22b60344bfb0099b9290a08bd64897c6 (page 2).pdf 6,210 × 8,537; 2.42 MB
-
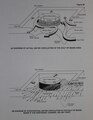
 Tidal Energy in the Gulf of Maine - DPLA - aedaaebd56a0919e4c8259fb533a4684 (page 1).jpg 3,602 × 2,314; 1.32 MB
-
 Tidal Energy in the Gulf of Maine - DPLA - aedaaebd56a0919e4c8259fb533a4684 (page 2).pdf 7,504 × 4,820; 1.33 MB
-
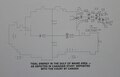
 Twice Daily Tidal Elipses - DPLA - 0c059eff2fb67b26b52e988c4c5a17c2 (page 1).jpg 3,540 × 1,781; 1.09 MB
-
 Twice Daily Tidal Elipses - DPLA - 0c059eff2fb67b26b52e988c4c5a17c2 (page 2).pdf 7,375 × 3,710; 1.1 MB
-

-

.jpg)
.jpg)
.jpg)
.jpg)