Category:Transport diagrams
Jump to navigation
Jump to search
Subcategories
This category has the following 10 subcategories, out of 10 total.
A
B
D
N
R
S
T
V
Media in category "Transport diagrams"
The following 200 files are in this category, out of 202 total.
(previous page) (next page)-
 A generic coach body (14776735385).jpg 2,856 × 1,824; 929 KB
-
 A Short History of Traffic Engineering.jpg 3,859 × 4,209; 1.03 MB
-
 A Short History of Traffic Engineering.png 2,480 × 3,508; 252 KB
-
 Akcesibilita železničních uzlů Ústeckého kraje.svg 828 × 437; 30 KB
-
 Akcesibilita.jpg 828 × 437; 49 KB
-
 Atmosphere composition diagram-en.svg 2,494 × 2,189; 295 KB
-
 Automobile Inefficiencies.png 4,267 × 4,267; 413 KB
-
 Avoid Shift Improve - Energy Efficiency.png 2,048 × 2,048; 86 KB
-
 Avoid Shift Improve - Instruments.png 4,267 × 4,267; 368 KB
-
 Avoid Shift Improve Traffic Generation.png 3,720 × 4,159; 294 KB
-
 Becquey concurrence fleuve-fer.jpg 696 × 467; 62 KB
-
 Beijing mobility trajectories from the GeoLife dataset.png 1,610 × 966; 1.15 MB
-
 Benefits of Sustainable Mobility.png 3,718 × 4,182; 418 KB
-
 Brake testing chart showing the percentage of vehicles stopping within given distances.jpg 5,320 × 4,596; 5.92 MB
-
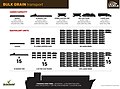 Bulk Grain Transport Capacities Infographic (11731986393).jpg 2,933 × 2,175; 772 KB
-
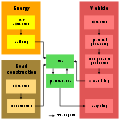 Car life cycle.svg 1,525 × 1,525; 19 KB
-
 Car-free Day. September 22 (29360790024).jpg 1,610 × 1,610; 695 KB
-
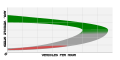
 Carbon Emissions Per Passenger.png 3,718 × 4,159; 414 KB
-
 CarDensities2010DensitéVéhicules.jpg 742 × 1,000; 184 KB
-
 Cars per 1000 Inhabitants.png 3,718 × 4,159; 415 KB
-
 CC Kiezblocks Grafik 2021.jpg 2,362 × 1,535; 601 KB
-
 Chance of Fatality by Impact Speed.png 3,764 × 4,159; 388 KB
-
 Climaxing A Century Of Progress In Transportation (NBY 415278).jpg 811 × 506; 85 KB
-
 Comparison motivations for carfree living.png 945 × 487; 42 KB
-
 Congestion Pricing Flowchart.png 1,285 × 993; 85 KB
-
 Corridor Capacity and Infrastructure Costs de.svg 1,241 × 1,246; 4.94 MB
-
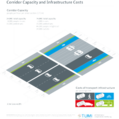 Corridor Capacity and Infrastructure Costs.png 4,141 × 4,159; 818 KB
-
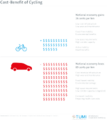 Cost-Benefit of Cycling.png 3,718 × 4,158; 290 KB
-
 Costos del sector transporte.jpg 4,032 × 3,024; 9.64 MB
-
 Courbe-en-C.png 405 × 365; 9 KB
-
 Diagramme Transport.png 693 × 421; 15 KB
-
 Diagramme-espace-temps-tiv-div.svg 3,983 × 1,902; 15 KB
-
 Diagramme-vitesse-constante.svg 3,923 × 1,879; 4 KB
-
 Distance intervéhiculaire.svg 3,827 × 1,146; 17 KB
-
 Druhy dopravy-poptavkova doprava.svg 357 × 336; 61 KB
-
 Définition vitesse.svg 3,992 × 1,494; 13 KB
-
 Eclipse SUMO, screenshot showing two microscopic views in SUMO version 1.6.0.png 1,920 × 1,040; 57 KB
-
 Ecran départ à quai - Version 2012.jpg 6,667 × 3,750; 1.91 MB
-
 Eixo LxSA-CS 2010.png 1,166 × 430; 80 KB
-
 Eixo LxSA-CS 2015.png 1,166 × 430; 74 KB
-
 Electric Bicycle Ownership in China.png 1,133 × 643; 52 KB
-
 Elements of Low-Carbon Urban Development.png 3,718 × 4,159; 322 KB
-
 Fahrgastzahlen GVH.svg 800 × 600; 20 KB
-
 Fahrgastzahlen HVV.svg 800 × 600; 20 KB
-
 Fahrgastzahlen MVV.svg 800 × 600; 20 KB
-
 Fahrgastzahlen RMV.svg 800 × 600; 19 KB
-
 Fahrgastzahlen VBB.svg 800 × 600; 18 KB
-
 Fahrgastzahlen VRR.svg 800 × 600; 24 KB
-
 Fahrgastzahlen VRS.svg 800 × 600; 21 KB
-
 Fahrgastzahlen VVS.svg 800 × 600; 31 KB
-
 Fahrneigungsregister Personen.svg 800 × 600; 25 KB
-
 FOB de las exportaciones.jpg 4,032 × 3,024; 7.66 MB
-
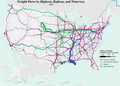 Freight flows by highway, railway, and waterway.webp 1,952 × 1,400; 388 KB
-
 Green-transport-hierarchy-pictogram.svg 1,052 × 744; 31 KB
-
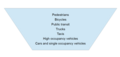 Green-transport-hierarchy.png 1,123 × 529; 45 KB
-
 Gráfico de costos.jpg 4,032 × 3,024; 7.46 MB
-
 Gvardeyka transport.png 3,308 × 2,400; 359 KB
-
 Historiograma empresas - v2 - CAT page-0001.jpg 1,431 × 533; 113 KB
-

-
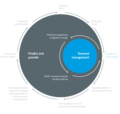
 Instruments of Transport Demand Management.png 3,796 × 4,158; 359 KB
-
 Land-Use Planning and Sustainable Transport.png 3,748 × 4,158; 410 KB
-
 Lock&dam 3.jpg 1,774 × 1,295; 708 KB
-
 Logistique fluvio-maritime.jpg 1,000 × 1,000; 151 KB
-
 Longueurs cumulees.JPG 1,152 × 864; 121 KB
-
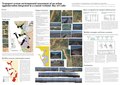 LunadelBarco et al 2002 poster.pdf 7,020 × 4,966; 2.63 MB
-
 MBmapabifurcacion.png 206 × 33; 4 KB
-
 Melbourne metropolitan public transport patronage from 1994.png 558 × 370; 35 KB
-
 Metro A, 2013.png 783 × 721; 17 KB
-
 Metro B, 2013.png 774 × 779; 20 KB
-
 Metro C, 2013.png 909 × 1,056; 24 KB
-
 Miljøvennlig transport (figur 1).png 839 × 476; 26 KB
-
 Miljøvennlig transport (figur 3).png 498 × 288; 11 KB
-
 Modal split-CR SLDB2001.svg 3,117 × 2,328; 16 KB
-
 Modalsplit Goederen.PNG 406 × 328; 5 KB
-
 Modele-forces-sociales.svg 3,492 × 1,531; 16 KB
-
 Mtl-trajet-2017-petit.png 2,032 × 1,211; 3.66 MB
-
 NIE 1905 Street Railway - miles of track over time.jpg 1,140 × 1,124; 186 KB
-
 Number of Passenger at Aobadai Sta.png 724 × 433; 14 KB
-
 Number of Passenger at Azamino Sta Denentoshi Line.png 646 × 402; 10 KB
-
 Number of Passenger at Azamino Sta.png 724 × 433; 18 KB
-
 Number of Passenger at Bandobashi Sta.png 646 × 430; 11 KB
-
 Number of Passenger at Eda Sta.png 724 × 433; 14 KB
-
 Number of Passenger at Fujigaoka Sta Denentoshi Line.png 724 × 433; 13 KB
-
 Number of Passenger at Futamatagawa Sta.png 646 × 415; 11 KB
-
 Number of Passenger at Gumyoji Sta.png 646 × 430; 12 KB
-
 Number of Passenger at Hakkeijima Sta.png 646 × 430; 13 KB
-
 Number of Passenger at Hakuraku Sta.png 666 × 392; 12 KB
-
 Number of Passenger at Higashi-Hakuraku Sta.png 666 × 392; 13 KB
-
 Number of Passenger at Hiranumabashi Sta.png 646 × 415; 11 KB
-
 Number of Passenger at Hiyoshi Sta.png 666 × 392; 12 KB
-
 Number of Passenger at Hoshikawa Sta.png 646 × 415; 12 KB
-
 Number of Passenger at Ichigao Sta.png 724 × 433; 14 KB
-
 Number of Passenger at Isezaki-chojamachi Sta.png 646 × 430; 11 KB
-
 Number of Passenger at Izumi-chuo Sta.png 646 × 415; 12 KB
-
 Number of Passenger at Izumino Sta.png 646 × 415; 11 KB
-
 Number of Passenger at Kamihoshikawa Sta.png 646 × 415; 11 KB
-
 Number of Passenger at Kaminagaya Sta.png 646 × 430; 12 KB
-
 Number of Passenger at Kamiohoka Sta.png 666 × 392; 13 KB
-
 Number of Passenger at Kamiooka Sta.png 600 × 353; 11 KB
-
 Number of Passenger at Kanazawa-Hakkei Sta.png 666 × 392; 13 KB
-
 Number of Passenger at Kannai Sta.PNG 625 × 392; 12 KB
-
 Number of Passenger at Kibogaoka Sta.png 646 × 415; 12 KB
-
 Number of Passenger at Kikuna Sta.png 625 × 392; 12 KB
-
 Number of Passenger at Kodomonokuni Sta.png 724 × 433; 14 KB
-
 Number of Passenger at Konanchuo Sta.png 646 × 430; 12 KB
-
 Number of Passenger at Maioka Sta.png 646 × 430; 12 KB
-
 Number of Passenger at Maita Sta.png 646 × 430; 12 KB
-
 Number of Passenger at Minamimakigahara Sta.png 646 × 415; 11 KB
-
 Number of Passenger at Mitsukyo Sta.png 646 × 415; 11 KB
-
 Number of Passenger at Nagatsuta Sta Denentoshi Line.png 646 × 402; 10 KB
-
 Number of Passenger at Nagatsuta Sta.PNG 725 × 434; 18 KB
-
 Number of Passenger at Nakada Sta.png 646 × 430; 10 KB
-
 Number of Passenger at Nishiya Sta.png 646 × 415; 11 KB
-
 Number of Passenger at Nishiyokohama Sta.png 646 × 415; 10 KB
-
 Number of Passenger at Odoriba Sta.png 646 × 430; 10 KB
-
 Number of Passenger at Onda Sta.png 724 × 433; 12 KB
-
 Number of Passenger at Ryokuentoshi Sta.png 646 × 415; 10 KB
-
 Number of Passenger at Sakuragicho Sta.png 666 × 392; 14 KB
-
 Number of Passenger at Seya Sta.png 646 × 415; 11 KB
-
 Number of Passenger at Shimoiida Sta.png 646 × 430; 10 KB
-
 Number of Passenger at Shimonagaya Sta.png 646 × 430; 11 KB
-
 Number of Passenger at Tama-Plaza Sta.png 724 × 433; 15 KB
-
 Number of Passenger at Tana Sta.png 724 × 433; 13 KB
-
 Number of Passenger at Tateba Sta.png 646 × 430; 11 KB
-
 Number of Passenger at Tennocho Sta.png 646 × 415; 11 KB
-
 Number of Passenger at Totsuka Sta.png 651 × 439; 12 KB
-
 Number of Passenger at Tsurugamine Sta.png 646 × 415; 11 KB
-
 Number of Passenger at Wadamachi Sta.png 646 × 415; 11 KB
-
 Number of Passenger at Yayoidai Sta.png 646 × 415; 11 KB
-
 Number of Passenger at Yokohama Sta.png 802 × 532; 20 KB
-
 Number of Passenger at Yoshinocho Sta.png 646 × 430; 12 KB
-
 Number of Passenger at Yumegaoka Sta.png 646 × 415; 10 KB
-
 Paralysation of Urban Transport Systems.png 4,451 × 4,159; 283 KB
-
 PIB enfoque de la producción.jpg 4,032 × 3,024; 7.82 MB
-
 Picture23GRDCFYIGHILJLKMKL;.M.png 780 × 410; 132 KB
-
 Picture25RETSRYDTUUTJRFUY.png 780 × 418; 134 KB
-
 Picture26345678OYHUKJJMBJGVG.png 544 × 447; 227 KB
-
 Picture27TER8TYHGMBJBHBK.png 403 × 368; 252 KB
-
 Picture28JGFUYFGKUIGUOUKHKU.png 538 × 293; 138 KB
-
 Picture29q4q3rwafartq2waresdrftgyh.png 759 × 808; 2.34 MB
-
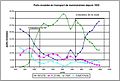
 Plan Becquey volume transport route-rail-voie navigable.jpg 672 × 795; 66 KB
-
 Plan71 wiki.png 619 × 2,150; 130 KB
-
 Plot of Numbers of Registered Vehicles in the United States by Year.png 1,128 × 832; 27 KB
-
 Potential Emissions Reduction.png 3,718 × 4,159; 299 KB
-
 Pražské metro-Počet přepravených Graf.jpg 832 × 380; 116 KB
-
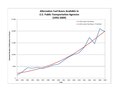 Predicted and Actual Alternative Fuel Bus Graph.pdf 1,650 × 1,275; 173 KB
-
 Predictive and Reactive Time Delay.jpg 780 × 552; 38 KB
-
 Querschnitt Konstruktion Padma-Brücke.svg 440 × 419; 17 KB
-
 Rail yard, Baku (P1090219).jpg 4,000 × 3,000; 9.39 MB
-
 Railway-electrification Europe 2005 en.png 1,062 × 660; 27 KB
-
 Ratio of traffic mode in freight transport in Germany 2002.png 720 × 535; 20 KB
-
 Recent trends in level crossing accidents Czech Republic.svg 1,200 × 500; 9 KB
-
 Refrigerated Truck Volumes.png 2,314 × 1,524; 240 KB
-
 Rl1000 cars150 p00.png 1,000 × 500; 23 KB
-
 Rl1000 cars150 p015.png 1,000 × 500; 78 KB
-
 Rl1000 cars300 p015 VDR.png 1,000 × 500; 96 KB
-
 Rl1000 cars300 p015.png 1,000 × 500; 126 KB
-
 Rosaparks busdiagram.jpg 1,033 × 1,200; 155 KB
-
 Rotoluve Modèle.jpg 730 × 761; 96 KB
-
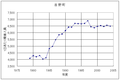
 S-Curve for the Global Container Shipping Industry.png 1,008 × 664; 39 KB
-
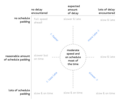 Schedule padding state space.png 1,500 × 1,304; 146 KB
-
 Skoda14tr11-stukture.svg 2,186 × 1,375; 120 KB
-
 Speed-flow horseshoe diagram traffic congestion.svg 800 × 400; 8 KB
-
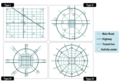
 Street Hierarchy and Accessibility.png 3,729 × 4,159; 442 KB
-
 Systeme routier.png 618 × 543; 29 KB
-
 Systeme-routier.svg 514 × 337; 14 KB
-
 Temps inter-véhiculaire.jpg 1,008 × 517; 47 KB
-
 The Car-free Matrix.png 3,829 × 4,159; 781 KB
-
 The History of Speed Demand.jpg 768 × 624; 68 KB
-
 The Vicious Cycle of Predict and Provide (cropped).png 3,737 × 3,547; 151 KB
-
 The Vicious Cycle of Predict and Provide de.svg 1,160 × 1,249; 3.45 MB
-
 The Vicious Cycle of Predict and Provide.png 3,745 × 4,159; 397 KB
-
 ThurstonMC.png 2,437 × 1,610; 36 KB
-
 TNT Express, un intégrateur mondial. Schéma d'activité.jpg 824 × 424; 103 KB
-
 Total Transport Energy Consumption in Europe.png 4,058 × 4,158; 215 KB
-
 Towards Sustainable Transport Systems.png 3,718 × 4,159; 361 KB
-
 Transhipment container port.png 567 × 264; 20 KB
-
 Transhipment container port.svg 569 × 267; 12 KB
-
 Transit Oriented Development.png 3,718 × 4,158; 280 KB
-
 Transport .png 717 × 498; 303 KB
-
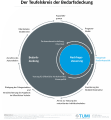
 Transport Demand Management - Challenges and Objectives.png 3,816 × 4,159; 299 KB
-
 Transport Demand Management - Push and Pull.png 3,719 × 4,159; 354 KB
-
 Transport Demand Management Awareness and Action.png 3,719 × 4,159; 331 KB
-
 Transport Development Pathways.png 3,871 × 4,159; 342 KB
-
 Transport Energy and Population Density by City.png 3,805 × 4,159; 403 KB
-
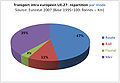 Transport intra européen - mode.jpg 1,547 × 1,075; 278 KB
-
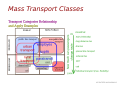 Transport-classes-en.svg 744 × 524; 74 KB
-
 Transports en France après le confinement.jpg 790 × 341; 95 KB
-
 Transports.svg 382 × 380; 72 KB
-
 Transports600 (English).svg 793 × 1,811; 1.07 MB
-
 Transports600.svg 793 × 1,811; 1.07 MB
-
 Treemap of most-produced vehicles to date.png 8,000 × 8,000; 1.36 MB
-
 Urban Transport and Morphology - Los Angeles.png 6,460 × 4,424; 630 KB
-
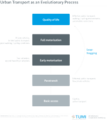 Urban Transport as an Evolutionary Process.png 3,717 × 4,159; 251 KB
-
 USCommutePatterns2006.png 1,672 × 943; 237 KB
-
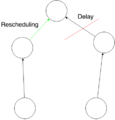 Vehicle Rescheduling.png 436 × 456; 17 KB
-
 Vicious Cycle of Automobile Dependency.png 3,718 × 4,182; 320 KB
-
 Viquiprojecte cadena fred.png 766 × 1,431; 95 KB
-
 VocaDi-Travel,Transport.jpeg 2,500 × 1,768; 1.08 MB
-
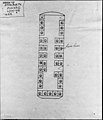
 Waihuanlu station diagram.jpg 1,512 × 2,016; 515 KB
.jpg)


.jpg)


.jpg)


.png)


.jpg)
.jpg)
.png)
.png)
.svg)