Category:Sociological trend graphs
Jump to navigation
Jump to search
Media in category "Sociological trend graphs"
The following 34 files are in this category, out of 34 total.
-
 1999 earnings ratio.jpg 545 × 327; 31 KB
-
 Adult Corrections Populations by Status - 1980-2012.png 1,291 × 779; 115 KB
-
 Alienation-connectedness continuum (Killeen, 1998).png 905 × 186; 16 KB
-
 BBC licences 1930.jpg 2,298 × 1,495; 1.75 MB
-
 Chart - Russia for Russians (1998-2011).svg 1,340 × 745; 28 KB
-
-
 Fidonodes (de).svg 732 × 530; 68 KB
-
 Fidonodes (en).svg 732 × 530; 68 KB
-
 Fidonodes (ru).svg 732 × 530; 69 KB
-
 Fidonodes.PNG 732 × 530; 39 KB
-
 Figure 2. .png 708 × 295; 13 KB
-
 Fréquence du terme gastronomie presse francophone.jpg 3,600 × 2,545; 579 KB
-
 Health Care Industries Annual Revenue 2000 to 2012.png 1,256 × 1,115; 53 KB
-
 Health Care Spending in Switzerland Per Capita, 1998 to 2008.JPG 768 × 329; 46 KB
-
 Historical homicide rate in Stockholm.svg 1,531 × 1,191; 177 KB
-
 Historiska mord i Stockholm 1400-2000.jpg 1,531 × 1,132; 138 KB
-
 Homicide rates 1960-2011.png 1,111 × 810; 50 KB
-
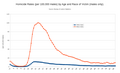 Homicide rates for males by age and race of victim.png 1,273 × 776; 64 KB
-
 Homicide rates for select countries 2012.png 1,312 × 835; 62 KB
-
 Infant Mortality Rates - 1950-2010.png 1,425 × 735; 113 KB
-
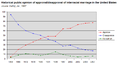
 Interracial marriage US 1972 2002.png 1,332 × 933; 54 KB
-
 Labor force participation rates - 1960-2045.png 944 × 697; 35 KB
-
 Marriage and Divorce Rates 1960-2011.png 1,652 × 1,082; 118 KB
-
 Marriage and Divorce Rates in the US 1990-2007.png 811 × 488; 38 KB
-
 Median Age by Region - 1950-2010.png 1,394 × 794; 103 KB
-
 Median Age for Select Countries - 1950-2010.png 1,473 × 702; 123 KB
-
 Percentage Reporting living together as acceptable option.png 1,207 × 819; 51 KB
-
 Percentages of Representatives and Senators who were Female - 1975-2011.png 1,385 × 1,123; 60 KB
-
 Public opinion of interracial marriage in the United States.png 875 × 464; 22 KB
-
 Rapes per 1000 by sex 1995-2010.png 1,188 × 808; 57 KB
-
 Trends in Poverty Rates by Ages in the US 1959-2012.png 1,562 × 810; 94 KB
-
 Trends in Total Fertility 1950-2010.png 1,317 × 743; 93 KB
-
 U.S. uninsured in 2007, by income.JPG 393 × 303; 18 KB
-
 Voter turnout.png 1,022 × 606; 49 KB


.svg)

.svg)
.svg)
.svg)


.png)