Category:Sinogram
Jump to navigation
Jump to search
A sinogram is the graphical representation of the Radon transform of an image. It consists of projections of the original image along each angular direction from 0° to 360° (or 180°). Every point in the original image shows up as a sine curve.
Media in category "Sinogram"
The following 15 files are in this category, out of 15 total.
-
 Coherent noise compare3.jpg 396 × 442; 21 KB
-
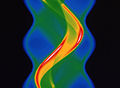
 Coherent state wavepacket.jpg 534 × 415; 32 KB
-
 CSIRO ScienceImage 257 SPECT Camera Sinogram.jpg 2,384 × 1,528; 2.54 MB
-
 CSIRO ScienceImage 267 SPEC Diagnosis Technique.jpg 709 × 519; 299 KB
-
 Evo-xiàng.svg 796 × 185; 9 KB
-
 Merging Sinuses.PNG 1,296 × 642; 356 KB
-
 Noise squeezed states.jpg 423 × 1,053; 73 KB
-
 Radon transform sinogram.gif 500 × 200; 1.02 MB
-
 Shepp logan radon.png 607 × 1,821; 28 KB
-
 Sinogram - Two Square Indicator Phantom.svg 414 × 312; 78 KB
-
 Sinogram and sample image of computed tomography of the jaw.jpg 926 × 394; 52 KB
-
 Sinogram Result - Two Squares Phantom.png 274 × 366; 7 KB
-
 SPECT Sinogram 360.jpg 227 × 287; 10 KB
-
 Squeezed states complete pic.png 1,080 × 980; 91 KB
-
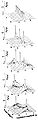 Wave packet squeezed states.jpg 1,085 × 3,420; 298 KB


